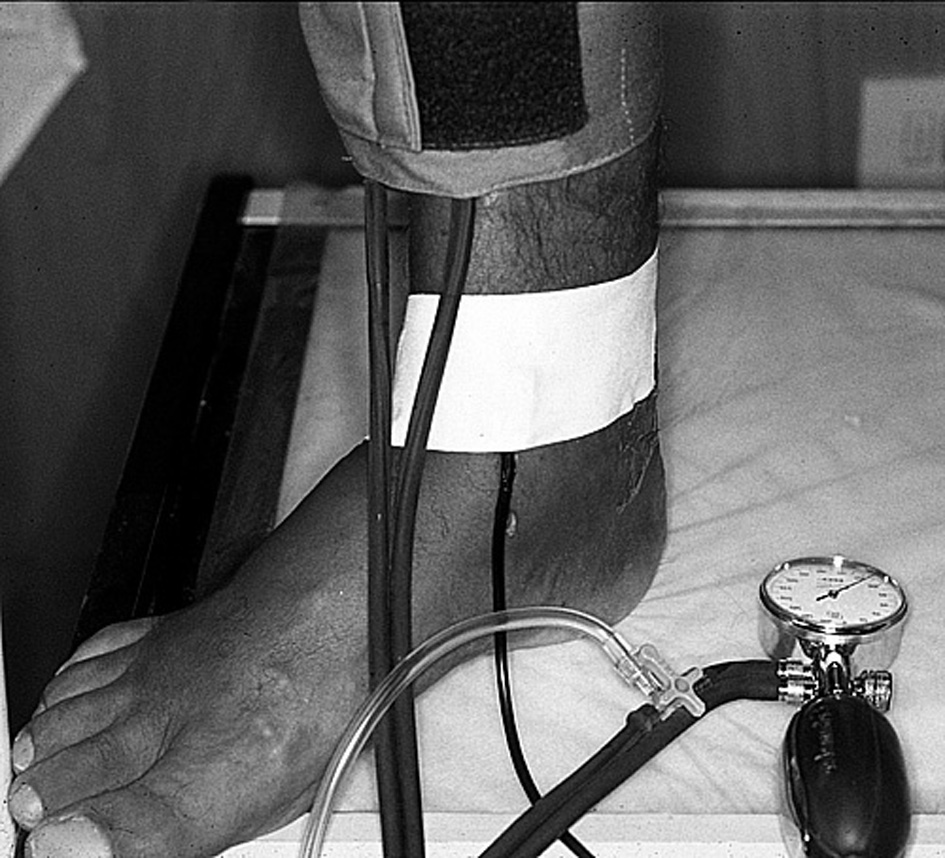
Figure 1. VPI Doppler measurement on a right LL of a patient affected with CVI. Placement of the pneumatic cuff and of the flat probe of 8 MHz by plaster is visible.
| Journal of Current Surgery, ISSN 1927-1298 print, 1927-1301 online, Open Access |
| Article copyright, the authors; Journal compilation copyright, J Curr Surg and Elmer Press Inc |
| Journal website http://www.currentsurgery.org |
Original Article
Volume 5, Number 4, December 2015, pages 188-198
The Value of Doppler Venous Pressure Index in Chronic Venous Disease of the Lower Limbs
Figures
Tables
| N | % | |
|---|---|---|
| CVI: chronic venous insufficiency. | ||
| Patients examined | 1,049 | 100 |
| Patients without CVI | 162 | 15.4 |
| Patients with CVI | 887 | 84.5 |
| Average age | 52.4 ± 16.2 | |
| Male | 273 | 26.0 |
| Female | 776 | 74.0 |
| Right | 554 | 52.8 |
| Left | 495 | 47.1 |
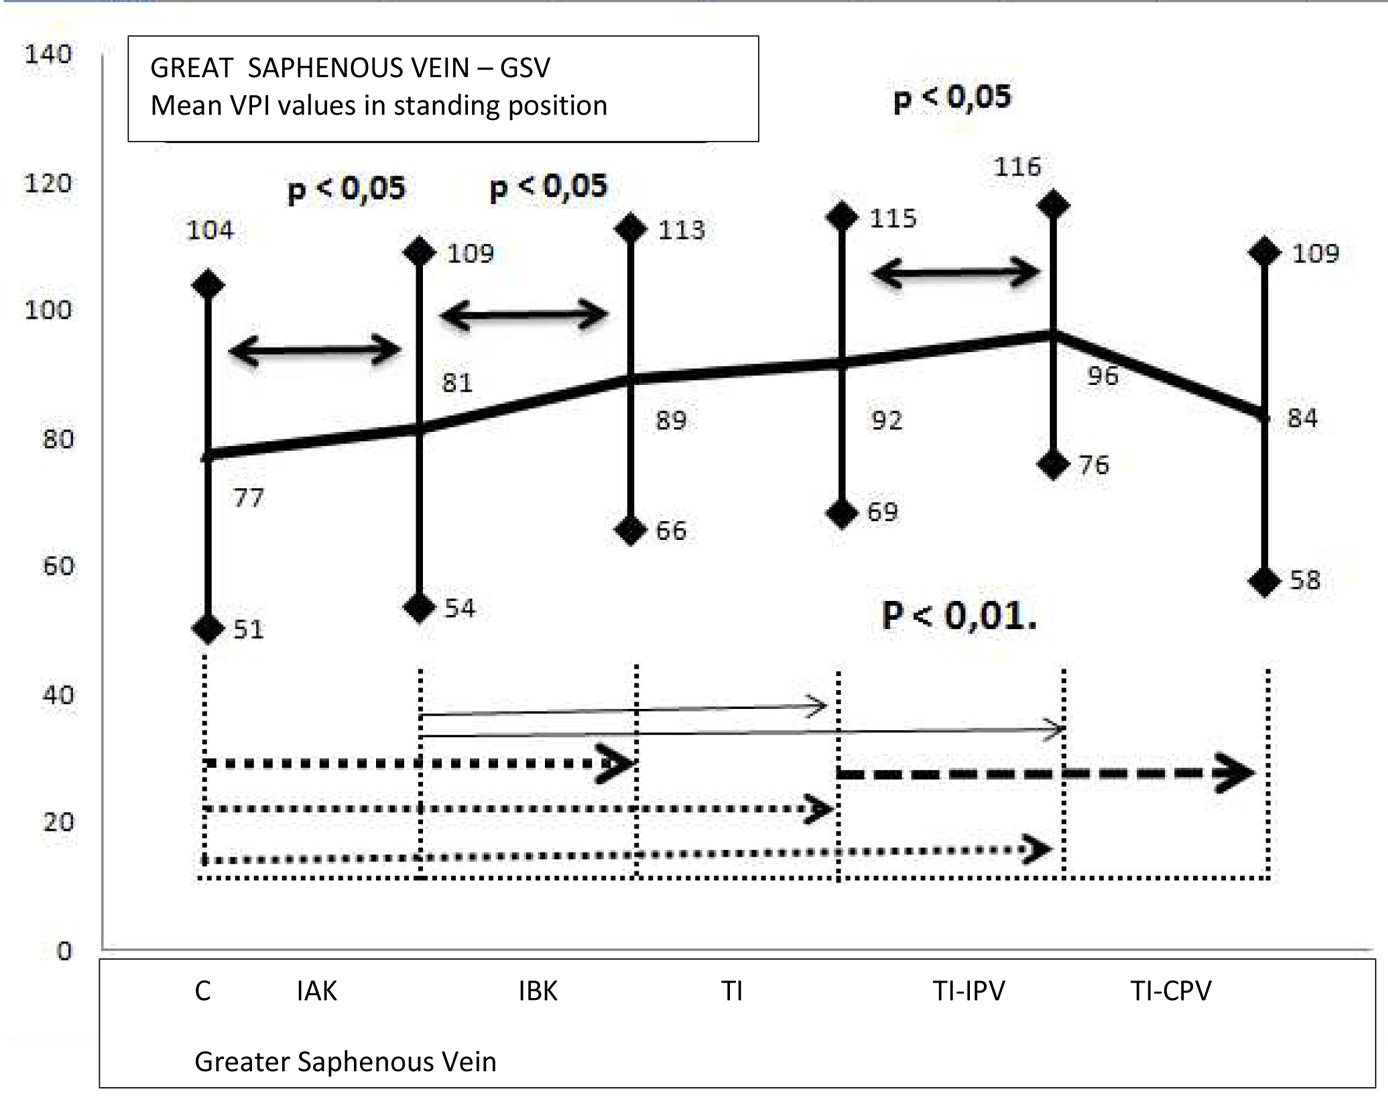
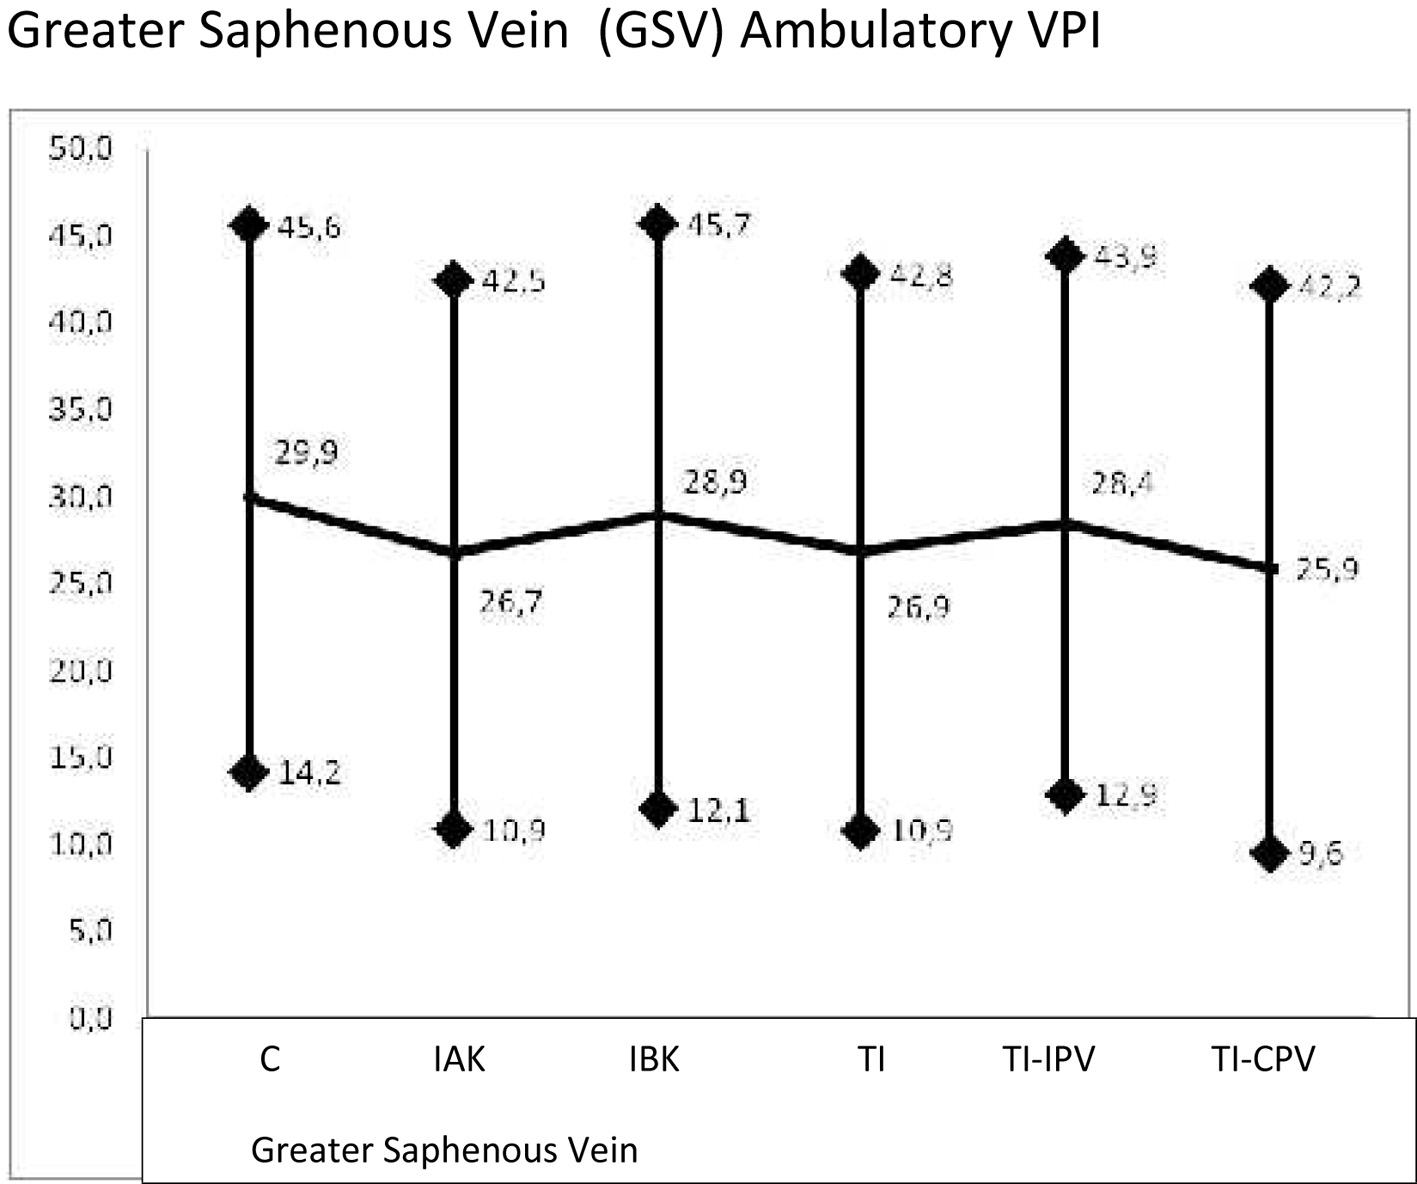
| Student’s t-test of the GSV of standing PVI values | |||||
|---|---|---|---|---|---|
| GSV C | GSV IAK | GSV IBK | GSV TI | GSV TI-IPV | |
| C: competent; IAK: incompetent above knee; IBK: incompetent below knee; TI: totally incompetent; TI-IPV: totally incompetent and incompetent perforating veins; TI-CPV: totally incompetent and competent perforating veins. | |||||
| GSV IAK | N.S. | ||||
| GSV IBK | 0.0002 | 0.0327 | |||
| GSV TI | 0.00001 | 0.00001 | N.S. | ||
| GSV TI-IPV | 0.0216 | N.S. | N.S. | 0.0048 | |
| GSV TI-CPV | 0.00001 | 0.00001 | 0.0344 | 0.0202 | 0.00001 |
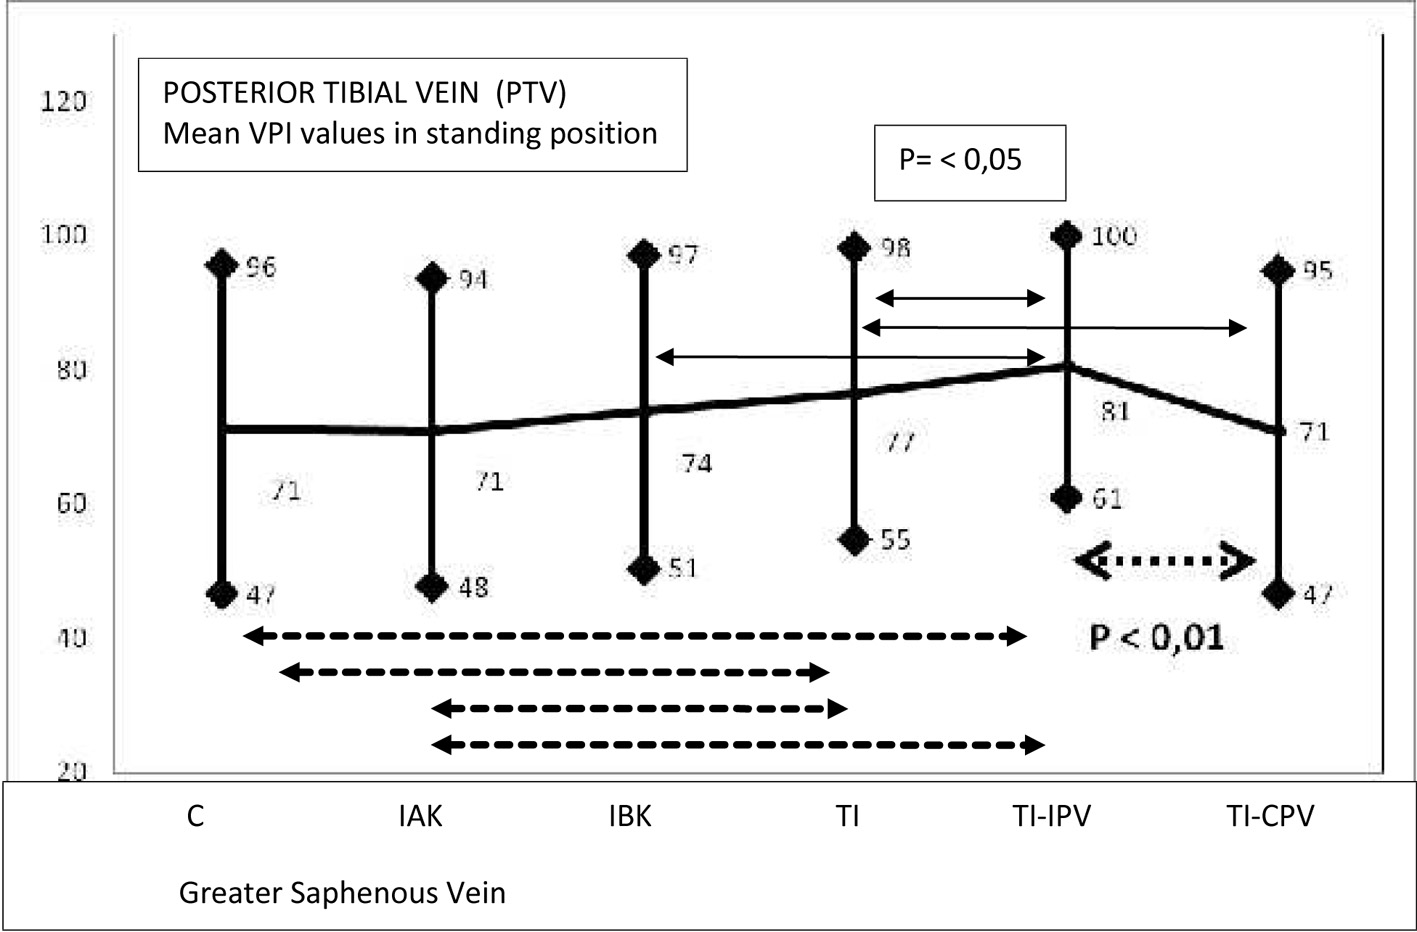
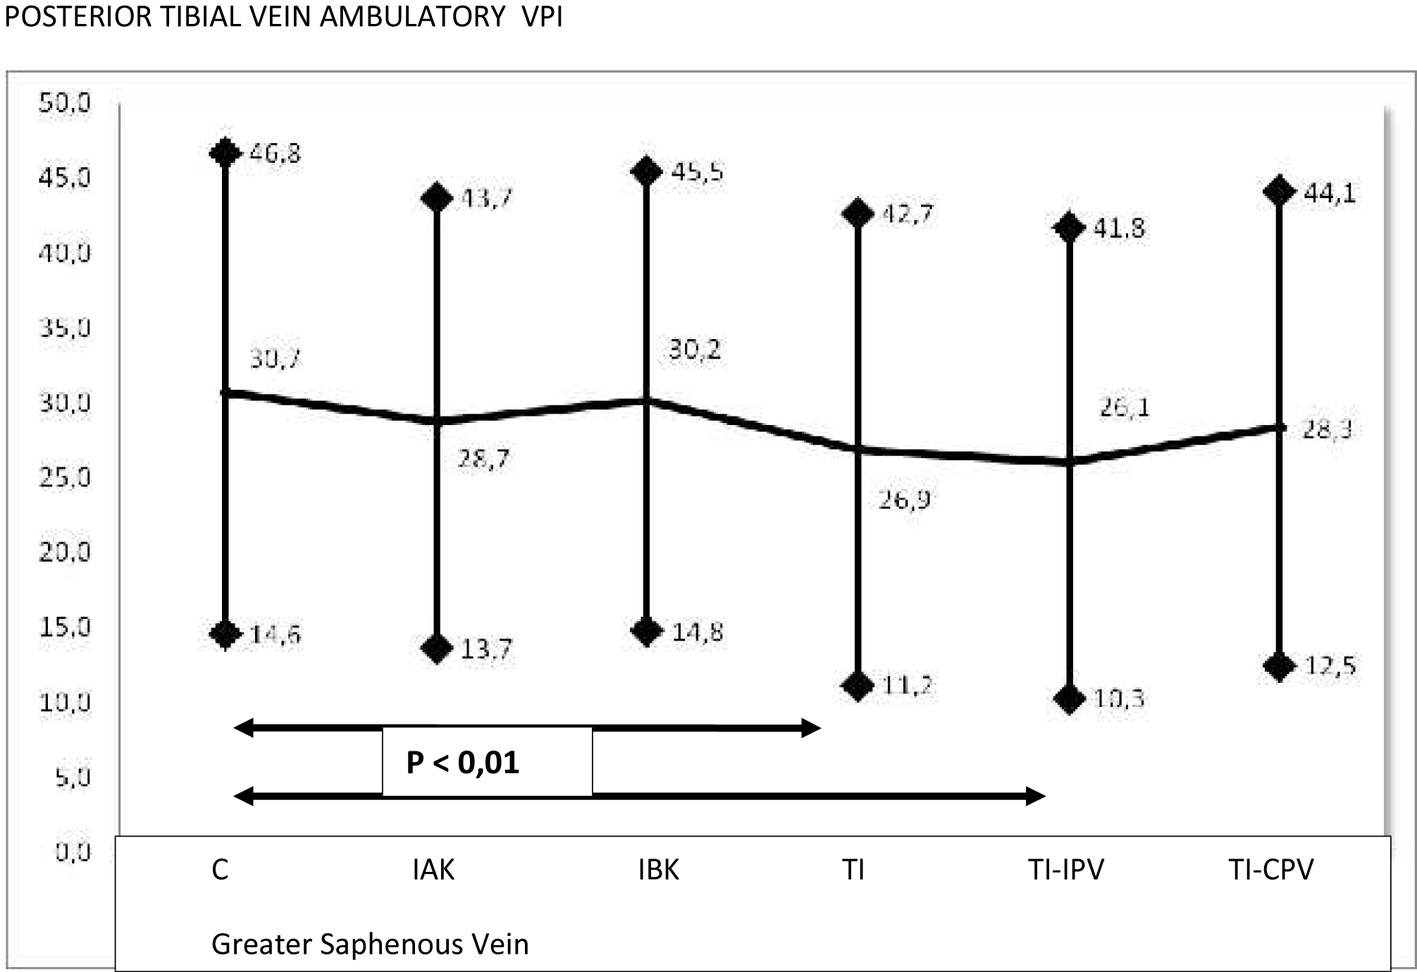
| Student’s t-test of the PSV of PVI standing values | |||||
|---|---|---|---|---|---|
| GSV C | GSV IAK | GSV IBK | GSV TI | GSV TI-IPV | |
| C: competent; IAK: incompetent above knee; IBK: incompetent below knee; TI: totally incompetent; TI-IPV: totally incompetent and incompetent perforating veins; TI-CPV: totally incompetent and competent perforating veins. | |||||
| GSV IAK | 0.844 | ||||
| GSV IBK | 0.367 | 0.356 | |||
| GSV TI | 0.001 | 0.010 | 0.381 | ||
| GSV TI-IPV | 0.897 | 0.976 | 0.406 | 0.030 | |
| GSV TI-CPV | 0.0001 | 0.00001 | 0.034 | 0.035 | 0.00001 |
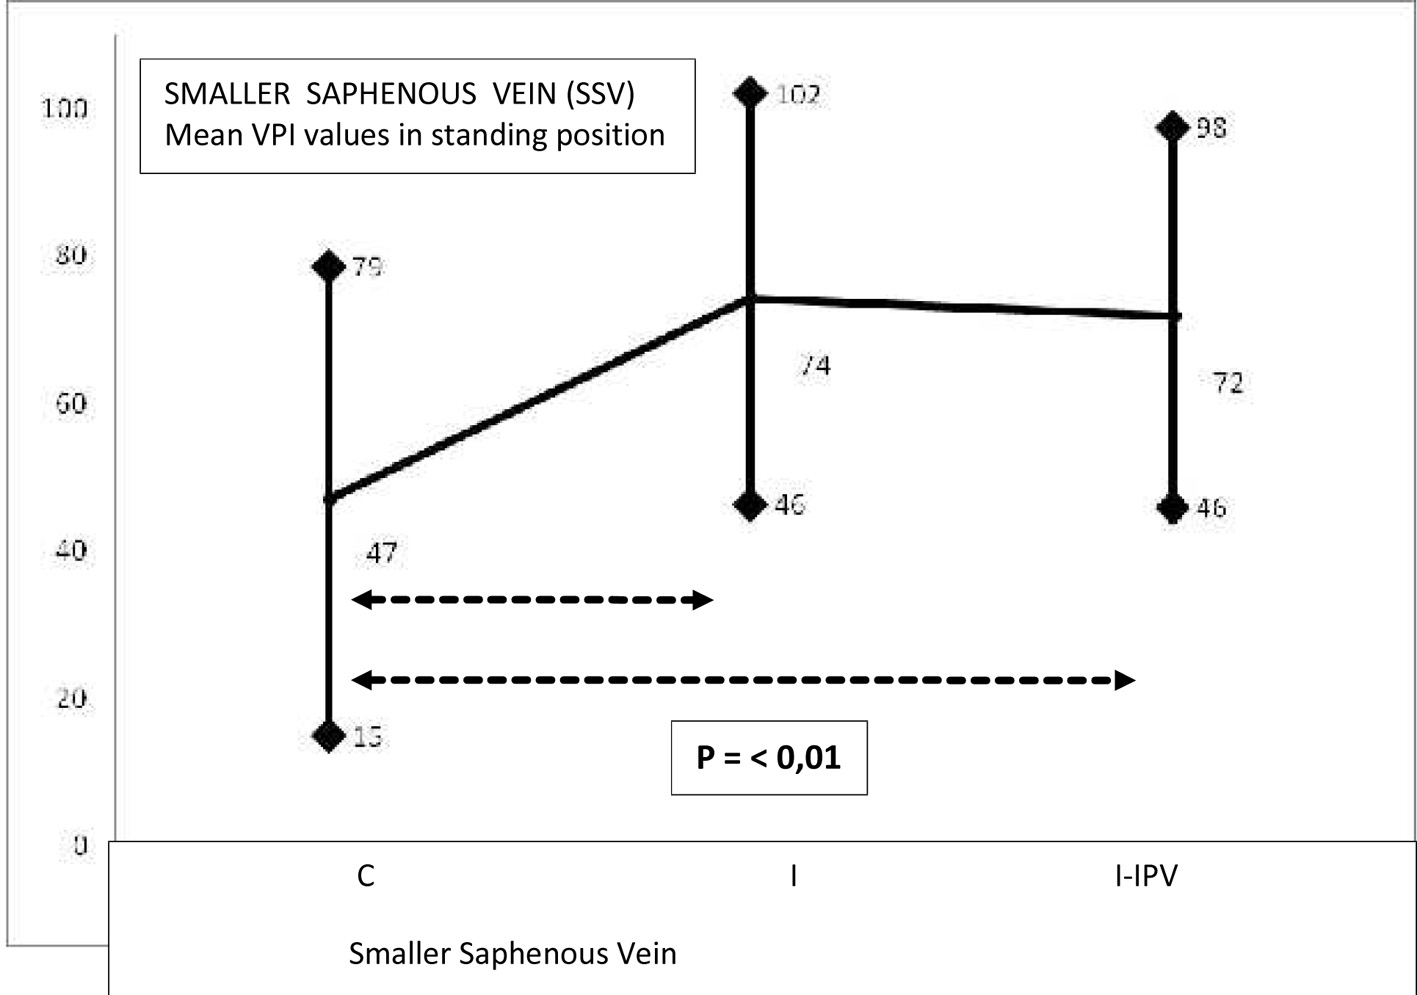
| SSV | ||
|---|---|---|
| C SSV | I SSV IPV | |
| The zeros preceding the reported values are 24 in the first column and 43 in the second (t < 0.01). SSV: smaller saphenous vein; C: competent; I: incompetent; IPV: incompetent perforating veins. | ||
| SSV C | 2.09 E - 24 | 5.27 E - 43 |
| GSV | Student’s t-test values | ||||
|---|---|---|---|---|---|
| IAK | IBK | TI | IPV | CPV | |
| C: competent; IAK: incompetent above knee; IBK: incompetent below the knee; TI: totally incompetent; TI-IPV: totally incompetent and incompetent perforating veins; TI-CPV: totally incompetent and competent perforating veins. | |||||
| C | 0.31 | 0.36 | 0.31 | 0.35 | 0.30 |
| IAK | 0.26 | 0.94 | 0.42 | 0.66 | |
| IBK | 0.23 | 0.81 | 0.11 | ||
| TI | 0.42 | 0.56 | |||
| IPV | 0.23 | ||||
| GSV | Student’s t-test values | ||||
|---|---|---|---|---|---|
| GSV RAK | GSV RBK | GSV RC | GSV RPV | GSV RC WRPV | |
| C: competent; IAK: incompetent above knee; IBK: incompetent below the knee; TI: totally incompetent; TI-IPV: totally incompetent and incompetent perforating veins; TI-CPV: totally incompetent and competent perforating veins. | |||||
| GSV C | 0.15 | 0.79 | 0.00097 | 0.00069 | 0.15 |
| GSV IAK | 0.52 | 0.25 | 0.12 | 0.85 | |
| GSV IBK | 0.13 | 0.07 | 0.45 | ||
| GSV TI | 0.57 | 0.43 | |||
| GSV IPV | 0.24 | ||||
| Bayesian test VPI | ||||
|---|---|---|---|---|
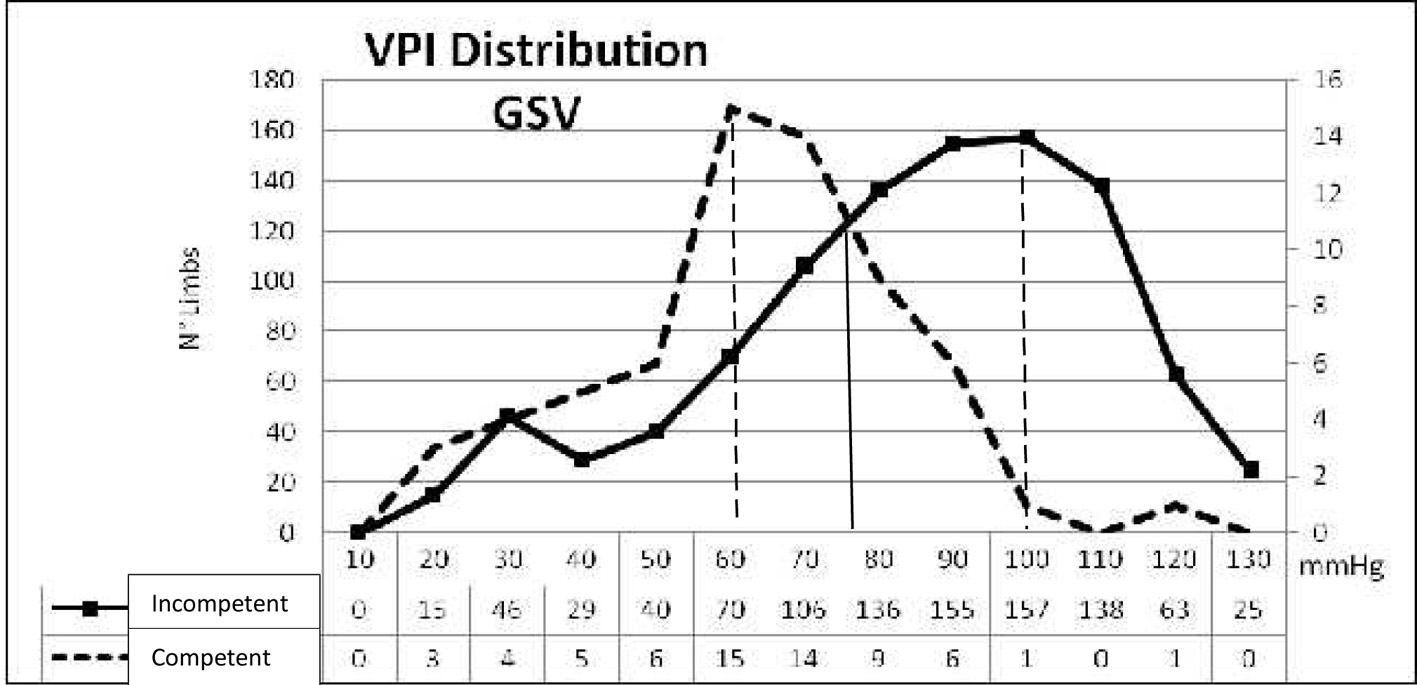
| The Statistic Bayesian test was performed in 1,044 limbs. Sensibility, specificity, the positive predictive value and the negative predictive value were calculated taking into consideration the VPI value of 80 mm Hg as resulting by the Bayesian calculator (Fig. 7). C 0-1, C 2-6 of C.E.A.P. classification. | ||||
| VPI | C 0-1 | C 2-6 | ||
| ≤ 80 | a | 56 | b | 442 |
| > 80 | c | 8 | d | 538 |
| CGSV VPI < 80 mm Hg | 56 | a | ||
| IGSV VPI > 80 | 442 | b | ||
| CGSV VPI < 80 | 538 | d | ||
| CGSV VPI > 80 | 8 | c | ||
| Total | 1,044 | a + b + c + d | ||
| Sensibility | 0.8750 a/(a + c) | |||
| Specificity | 0.5490 d/(b + d) | |||
| Pos. predictive value | 0.1124 a/(a + b) | |||
| Neg. predictive value | 0.9853 d/(c + d) | |||
| Bayesian test SSV | ||||
|---|---|---|---|---|
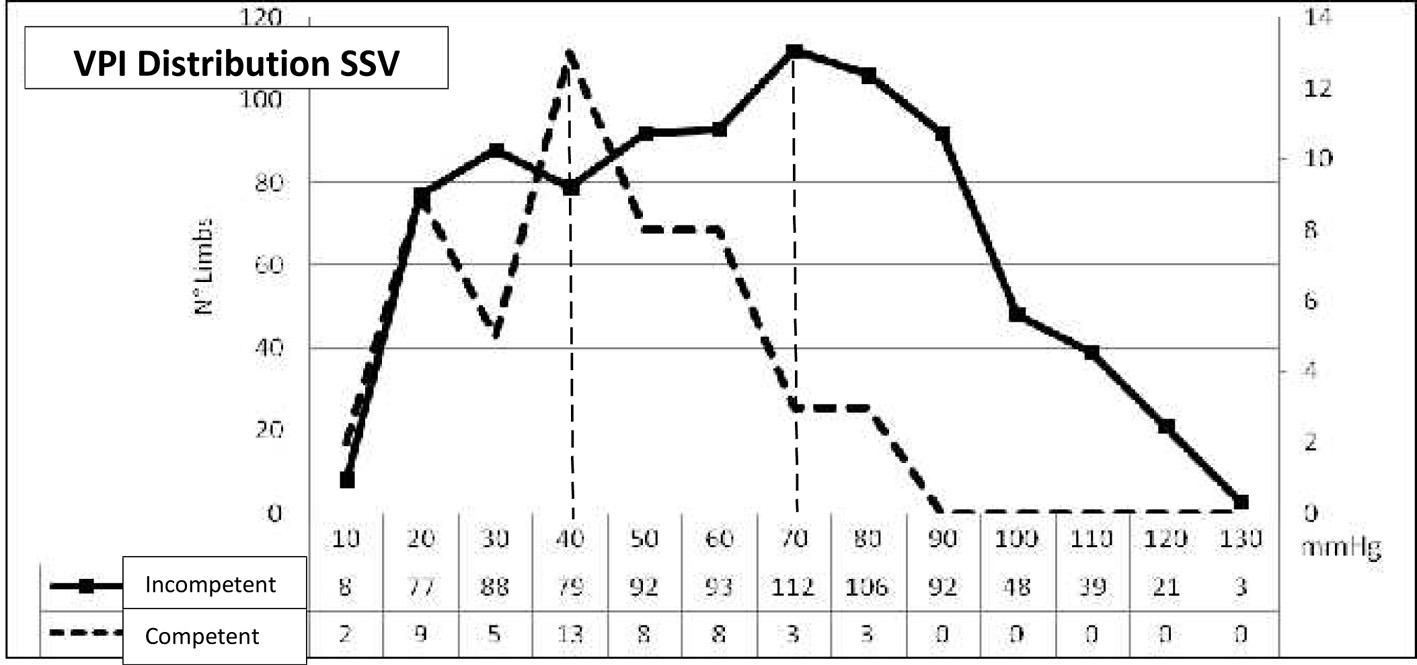
| The statistic Bayesian test was performed in 1,044 limbs. Sensibility, specificity, the positive predictive value and the negative predictive value were calculated taking into consideration the VPI value of 70 mm Hg as resulting by the Bayesian calculator (Fig. 8). C 0-1, C 2-6 of C.E.A.P. classification. | ||||
| VPI | C 0-1 | C 2-6 | ||
| < 70 | a | 48 | b | 309 |
| ≥ 70 | c | 3 | d | 437 |
| CSSV VPI < 70 mm Hg | 48 | a | ||
| ISSV VPI > 70 | 309 | b | ||
| CSSV VPI < 70 | 437 | d | ||
| CSSV VPI > 70 | 3 | c | ||
| Total | 797 | a + b + c + d | ||
| Sensibility | 0.9412 a/(a + c) | |||
| Specificity | 0.5858 d/(b + d) | |||
| Pos. predictive value | 0.1345 a/(a + b) | |||
| Neg. predictive value | 0.9932 d/(c + d) | |||
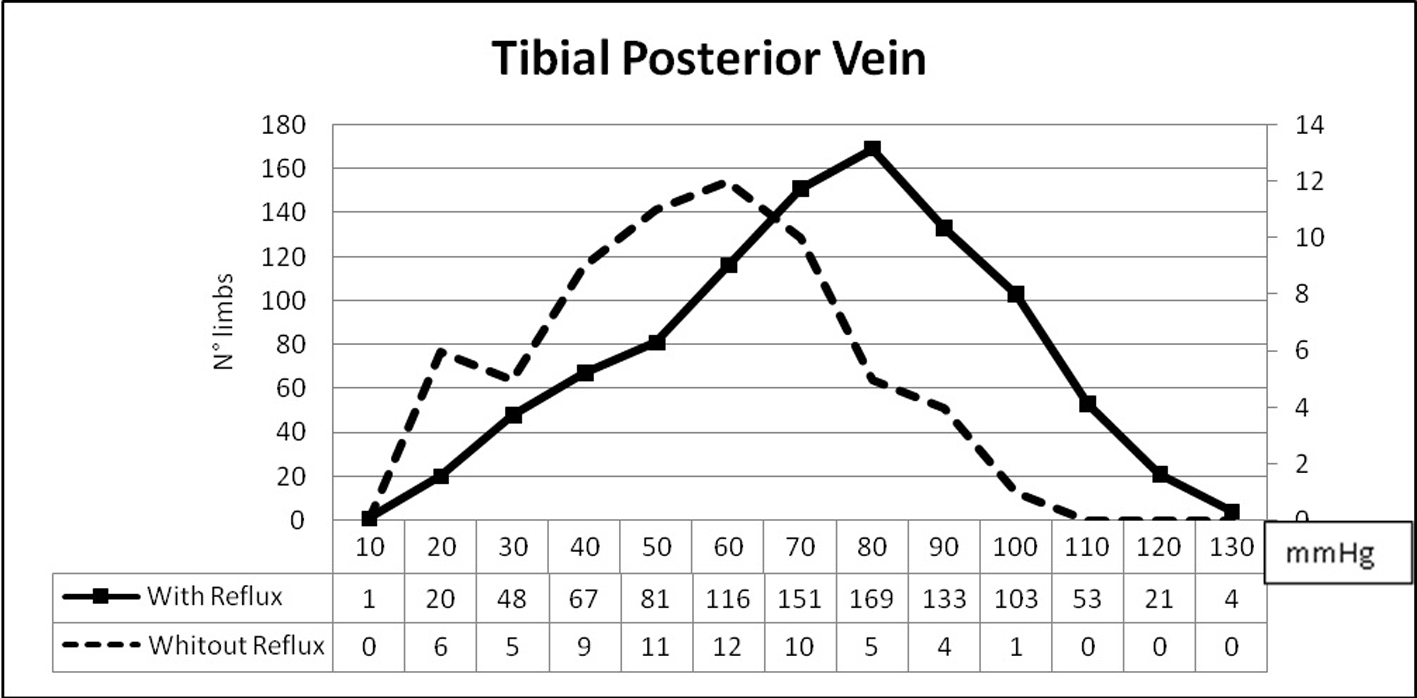
| Bayesian test PTV | ||||
|---|---|---|---|---|
| The statistic Bayesian test was performed in 1,044 limbs. Sensibility, specificity, the positive predictive value and the negative predictive value were calculated taking into consideration the VPI value of 80 mm Hg as resulting by the Bayesian calculator (Fig. 9). C 0-1, C 2-6 of C.E.A.P. classification. | ||||
| VPI | C 0-1 | C 2-6 | ||
| < 80 | a | 53 | b | 484 |
| ≥ 80 | c | 10 | d | 483 |
| CSSV VPI < 80 mm Hg | 53 | a | ||
| ISSV VPI > 80 | 484 | b | ||
| CSSV VPI < 80 | 483 | d | ||
| CSSV VPI > 80 | 10 | c | ||
| Total | 1,030 | a + b + c + d | ||
| Sensibility | 0.8413 a/(a + c) | |||
| Specificity | 0.4995 d/(b + d) | |||
| Pos. predictive value | 0.0987 a/(a + b) | |||
| Neg. predictive value | 0.9797 d/(c + d) | |||