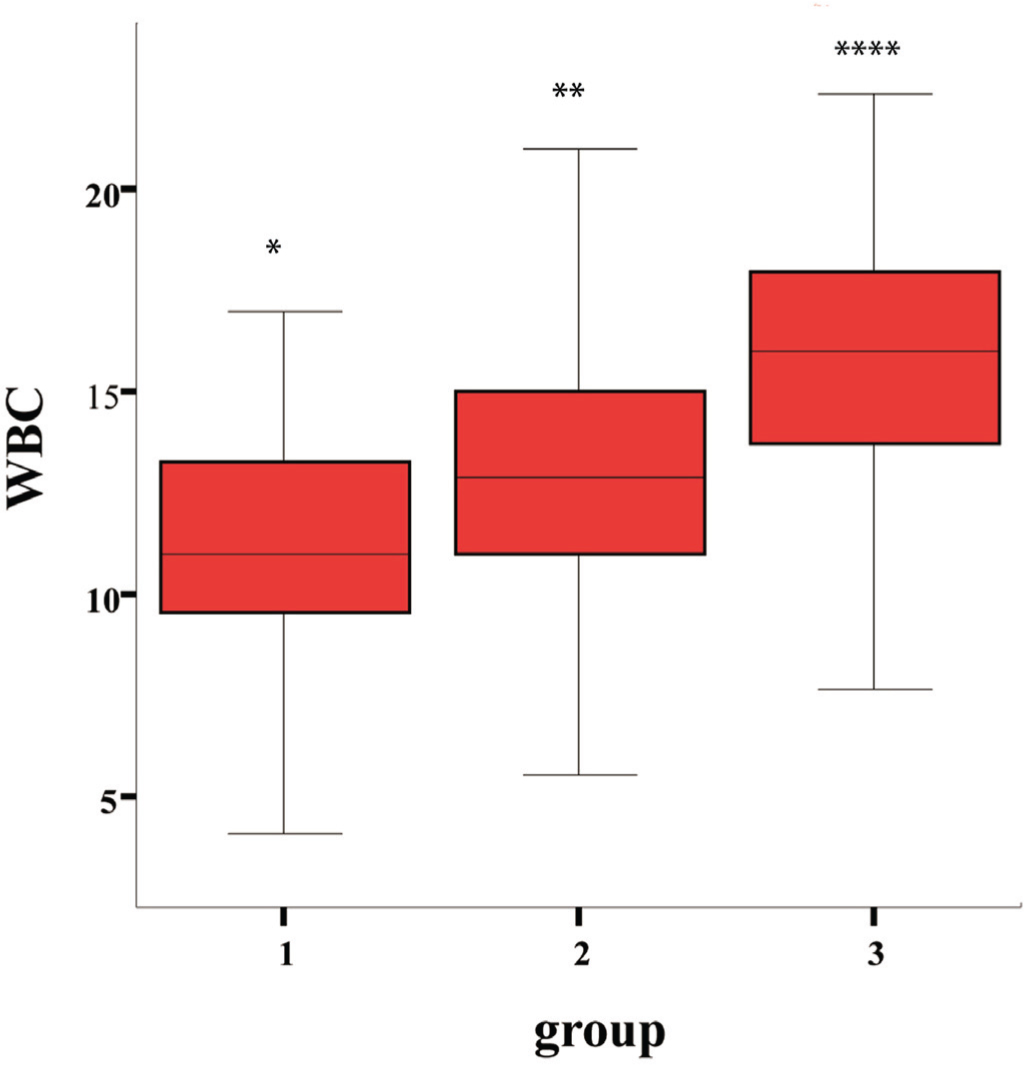
Figure 1.WBC. WBC levels in Groups (Groups 1 to 3).
| Journal of Current Surgery, ISSN 1927-1298 print, 1927-1301 online, Open Access |
| Article copyright, the authors; Journal compilation copyright, J Curr Surg and Elmer Press Inc |
| Journal website http://www.currentsurgery.org |
Original Article
Volume 2, Number 1, February 2012, pages 11-16
Effect of Time in the Development of Perforated Appendicitis
Figure
Tables
| Age Group | Male (%) | Female (%) | All patients (%) |
|---|---|---|---|
| 13 - 19 | 51 (63.0) | 30 (37.0) | 81 (100.0) |
| 20 - 49 | 143 (58.1) | 103 (41.9) | 246 (100.0) |
| ≥ 50 | 24 (66.7) | 12 (33.3) | 36 (100.0) |
| Total | 218 (60.1) | 145 (39.9) | 363 (100.0) |
| Group | n | Age (years) | Gender (n%) | |
|---|---|---|---|---|
| Mean (± SD, min-max) | Male | Female | ||
| 1 | 132 | 30.29 ± 12.80 | 64/48.4 | 68/51.6 |
| 2 | 186 | 29.31 ± 12.85 | 123/66.1 | 63/33.9 |
| 3 | 45 | 31.89 ± 17.20 | 31/68.8 | 14/31.2 |
| Total | 363 | 29.99 | 218/60.1 | 145/39.9 |
| Age | Acute | Phlegmonous | Perforated | |||
|---|---|---|---|---|---|---|
| Male(n)Hour (n) | Female (n) Hour (n) | Male(n) Hour (n) | Female (n) Hour (n) | Male(n) Hour (n) | Female (n) Hour (n) | |
| 13 - 19 | 32.0 (12) | 35.2 (15) | 34.4 (30) | 30.0 (12) | 74.6 (9) | 160.0 (3) |
| 20 - 49 | 32.8 (46) | 39.5 (48) | 37.3 (79) | 32.6 (47) | 46.6 (18) | 87.0 (8) |
| ≥ 50 | 36.0 (6) | 33.6 (5) | 42.8 (14) | 66.0 (4) | 60.0 (4) | 56.0 (3) |
| All | 33.0 (64) | 38.1 (68) | 37.2 (123) | 34.2 (63) | 56.5 (31) | 96.0 (14) |
| Group | WBC (± SD) P < 0.05 | HGB (± SD, min-max) P > 0.05 | Length of appendix (± SD , min-max) P > 0.05 | Dimension of appendix (± SD , min-max) P < 0.05 |
|---|---|---|---|---|
| 1 (n = 132) | 11.54 ( ± 3.28) | 13.24 ( ± 1.7) | 6.82 (± 1.59) | 0.82 (± 0.42) |
| 2 (n = 186) | 12.37 ( ± 3.24) | 13.38 ( ± 1.8) | 6.91 (± 1.62) | 1.04 (± 0.68) |
| 3 (n = 45) | 15.49 ( ± 3.75) | 13.34 ( ± 1.5) | 6.92 (± 1.53) | 1.42 (± 0.67) |
| Average ± SD | P | |
|---|---|---|
| Inflammation | 0.000* | |
| Acute | 1.85 ± 1.03 | |
| Plegmonous | 2.25 ± 2.44 | |
| Perforated or gangrenous | 4.24 ± 2.39 |
| Acuten (%) | Phlegmonous n (%) | Perforated n (%) | P | |
|---|---|---|---|---|
| USG | 0.715 | |||
| Appendicitis (+) | 59 (44.7) | 87 (46.8) | 25 (57.8) | |
| Appendicitis (-) | 73 (55.3) | 99 (53.2) | 19 (42.2) |