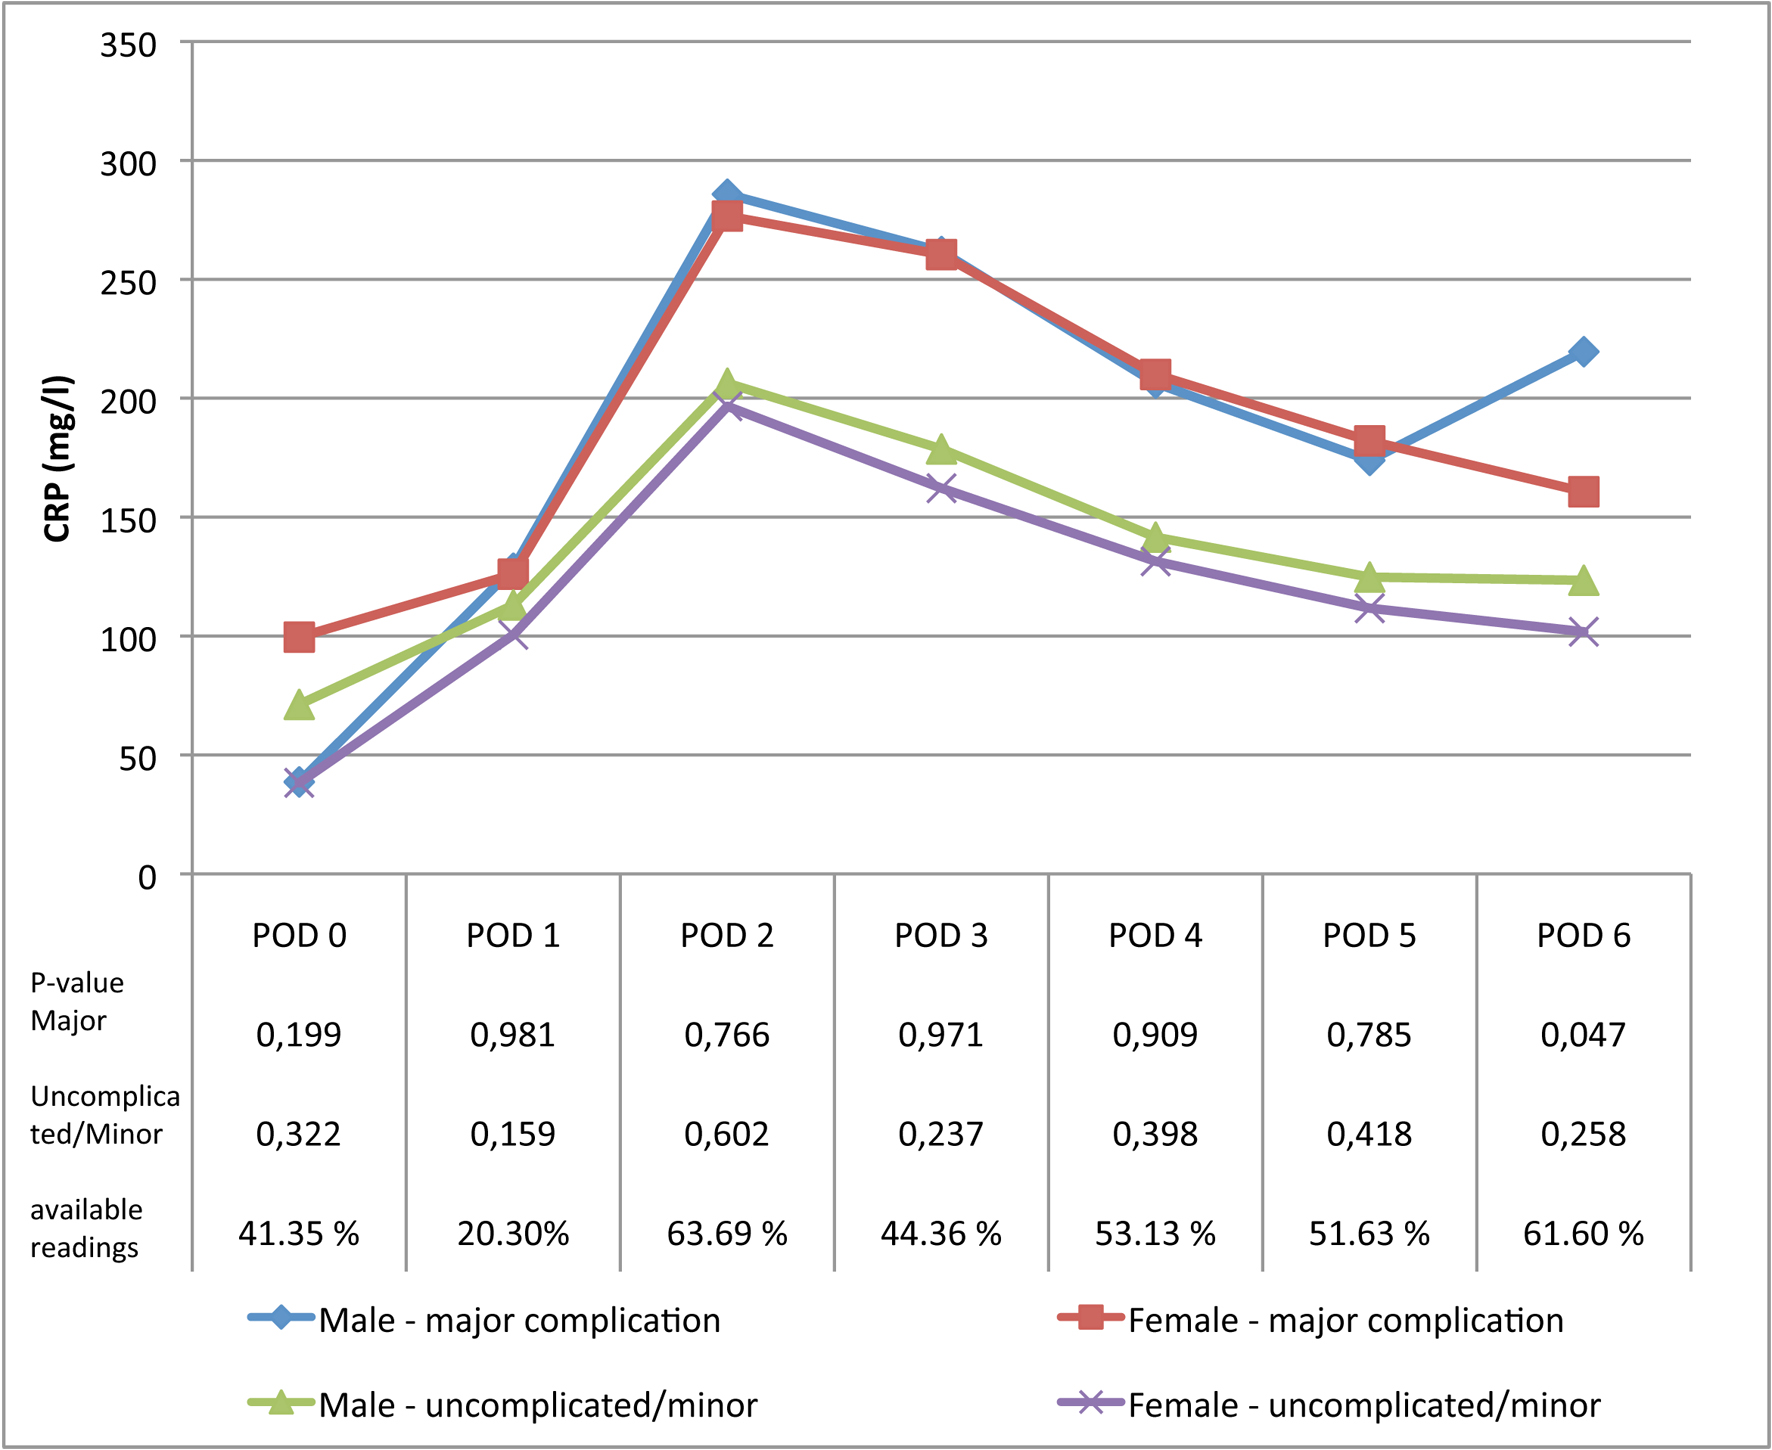
Figure 1. Average CRP levels in male and female patients with a minor or uncomplicated postoperative course and male and female patients with major complications.
| Journal of Current Surgery, ISSN 1927-1298 print, 1927-1301 online, Open Access |
| Article copyright, the authors; Journal compilation copyright, J Curr Surg and Elmer Press Inc |
| Journal website http://www.currentsurgery.org |
Original Article
Volume 4, Number 3, September 2014, pages 61-69
The Effect of Gender, Age and BMI on Postoperative C-Reactive Protein Levels After Major Abdominal Surgery
Figures
Tables
| Parameter | Upper GI | HPB | Lower GI | Total | P-value |
|---|---|---|---|---|---|
| Patients (n) | 74 (18.5%) | 91 (22.8%) | 234 (58.6%) | 399 | |
| Gender | |||||
| Male | 50 (67.6%) | 54 (59.3%) | 131 (56.0%) | 235 (58.9%) | |
| Female | 24 (32.4%) | 37 (40.7%) | 103 (44.0%) | 164 (41.1%) | 0.209 |
| Age, years (mean ± SD) | 63.2 ± 13.4 | 59.2 ± 11.6 | 59.6 ± 17.3 | 60.2 ± 15.5 | 0.168 |
| ASA score (mean ± SD) | 1.2 ± 0.7 | 1.1 ± 0.5 | 1.1 ± 0.7 | 1.1 ± 0.7 | 0.291 |
| BMI mean ± SD | 23.9 ± 3.8 | 25.1 ± 4.2 | 25.6 ± 6.1 | 25.1 ± 5.3 | 0.066 |
| Indication | |||||
| Elective | 65 (87.8%) | 87 (95.6%) | 176 (75.2%) | 328 (82.2%) | |
| Acute | 9 (12.1%) | 4 (4.4%) | 58 (24.8%) | 71 (17.8%) | 0.001 |
| Malignant | 61 (82.4%) | 76 (83.5%) | 137 (58.5%) | 274 (68.7%) | |
| Benign | 13 (17.6%) | 15 (16.5%) | 97 (41.5%) | 125 (31.3%) | < 0.001 |
| Epidural anesthesia | 42 (58.3%) | 62 (68.9%) | 127 (55.9%) | 231 (57.9%) | 0.105 |
| Operation access | |||||
| Laparotomy | 49 (66.2%) | 78 (85.7%) | 121 (51.7%) | 248 (62.2%) | |
| Laparoscopy | 20 (27%) | 13 (14.3%) | 96 (41%) | 129 (32.3%) | |
| Conversion | 5 (6.8%) | 0 | 17 (7.3%) | 22 (5.5%) | < 0.001 |
| Anastomosis | 64 (86.5%) | 24 (26.4%) | 168 (71.8%) | 256 (64.2%) | < 0.001 |
| Ostomy | 0 | 0 | 80 (38.6%) | < 0.001 | |
| Protective ostomy | 0 | 0 | 27 (11.5%) | < 0.001 | |
| Drain (mL ± SD) | 56 (78.9%) | 39 (43.8%) | 91 (39.7%) | 186 (46.6%) | 0.001 |
| Duration of surgery (min ± SD) | 275.8 ± 105.4 | 249.5 ± 214.5 | 188.1 ± 75.6 | 217.6 ± 132.7 | < 0.001 |
| Perioperative blood loss (mL ± SD) | 451.7 ± 774.8 | 347.4 ± 521.8 | 229.1 ± 478.1 | 295.7 ± 554 | 0.016 |
| Complication | 39 (52.7%) | 22 (24.2%) | 82 (35%) | 143 (35.8%) | 0.002 |
| Major complication | 26 (35.1%) | 12 (13.2%) | 45 (19.2%) | 83 (20.8%) | 0.002 |
| Minor complication | 13 (17.6%) | 10 (11%) | 36 (15.4%) | 59 (14%) | |
| Hospital stay (days ± SD) | 24.7 ± 22.3 | 11.4 ± 17.2 | 15.3 ± 20.7 | 16.1 ± 20.7 | < 0.001 |
| Intensive care stay (days ± SD) | 13.1 ± 20.7 | 6.8 ± 16.9 | 11.5 ± 17.4 | 11.3 ± 18.8 | 0.496 |
| Mortality | 6 (8.1%) | 2 (2.2%) | 6 (2.6%) | 14 (3.5%) | 0.058 |
| POD | Overall | Major complications | ||||
|---|---|---|---|---|---|---|
| Mean CRP (mg/L) ± SD | Correlation | P-value | Mean CRP (mg/L) ± SD | Correlation | P-value | |
| 0 | 61.27 ± 119 | -0.109 | 0.334 | 69.13 ± 113 | -0.198 | 0.353 |
| 1 | 112.2 ± 67.3 | 0.099 | 0.117 | 127.6 ± 84.4 | 0.388 | 0.543 |
| 2 | 219.8 ± 109.1 | -0.092 | 0.225 | 281.5 ± 94.5 | -0.197 | 0.229 |
| 3 | 192.3 ± 101.6 | 0.029 | 0.674 | 261.1 ± 117.5 | -0.021 | 0.889 |
| 4 | 154.7 ± 89.5 | -0.092 | 0.189 | 207.92 ± 110.8 | -0.104 | 0.467 |
| 5 | 137.6 ± 93.4 | -0.061 | 0.433 | 177.2 ± 103.9 | -0.075 | 0.602 |
| 6 | 138.8 ± 101.6 | -0.021 | 0.803 | 194.1 ± 97.9 | 0.031 | 0.84 |
| POD | Overall | Major complications | ||||
|---|---|---|---|---|---|---|
| Mean CRP (mg/L) ± SD | Correlation | P-value | Mean CRP (mg/L) ± SD | Correlation | P-value | |
| 0 | 61.27 ± 119 | 0.28 | 0.015 | 69.13 ± 113 | 0.226 | 0.312 |
| 1 | 112.2 ± 67.3 | 0.197 | 0.002 | 127.6 ± 84.4 | 0.251 | 0.07 |
| 2 | 219.8 ± 109.1 | 0.158 | 0.04 | 281.5 ± 94.5 | 0.293 | 0.07 |
| 3 | 192.3 ± 101.6 | 0.139 | 0.048 | 261.1 ± 117.5 | 0.172 | 0.248 |
| 4 | 154.7 ± 89.5 | 0.231 | 0.001 | 207.92 ± 110.8 | 0.314 | 0.028 |
| 5 | 137.6 ± 93.4 | 0.082 | 0.304 | 177.2 ± 103.9 | 0.146 | 0.311 |
| 6 | 138.8 ± 101.6 | 0.095 | 0.262 | 194.1 ± 97.9 | 0.051 | 0.744 |
| POD | B | Sig | Beta | R-square |
|---|---|---|---|---|
| 3 | 2.982 | 0.03 | 0.153 | 0.023 |
| 4 | 2.687 | 0.023 | 0.164 | 0.027 |
| 5 | 1.012 | 0.502 | 0.053 | 0.003 |