Journal of Current Surgery, ISSN 1927-1298 print, 1927-1301 online, Open Access
Article copyright, the authors; Journal compilation copyright, J Curr Surg and Elmer Press Inc
Journal website http://www.currentsurgery.org

Original Article

Volume 6, Number 1, March 2016, pages 21-29


Length of Hospitalization: A Protective Factor in a Prospective Observational Cohort Study in Brazilian ASA III and IV Hip Fracture Elderly Patients

Figures

Figure 1.
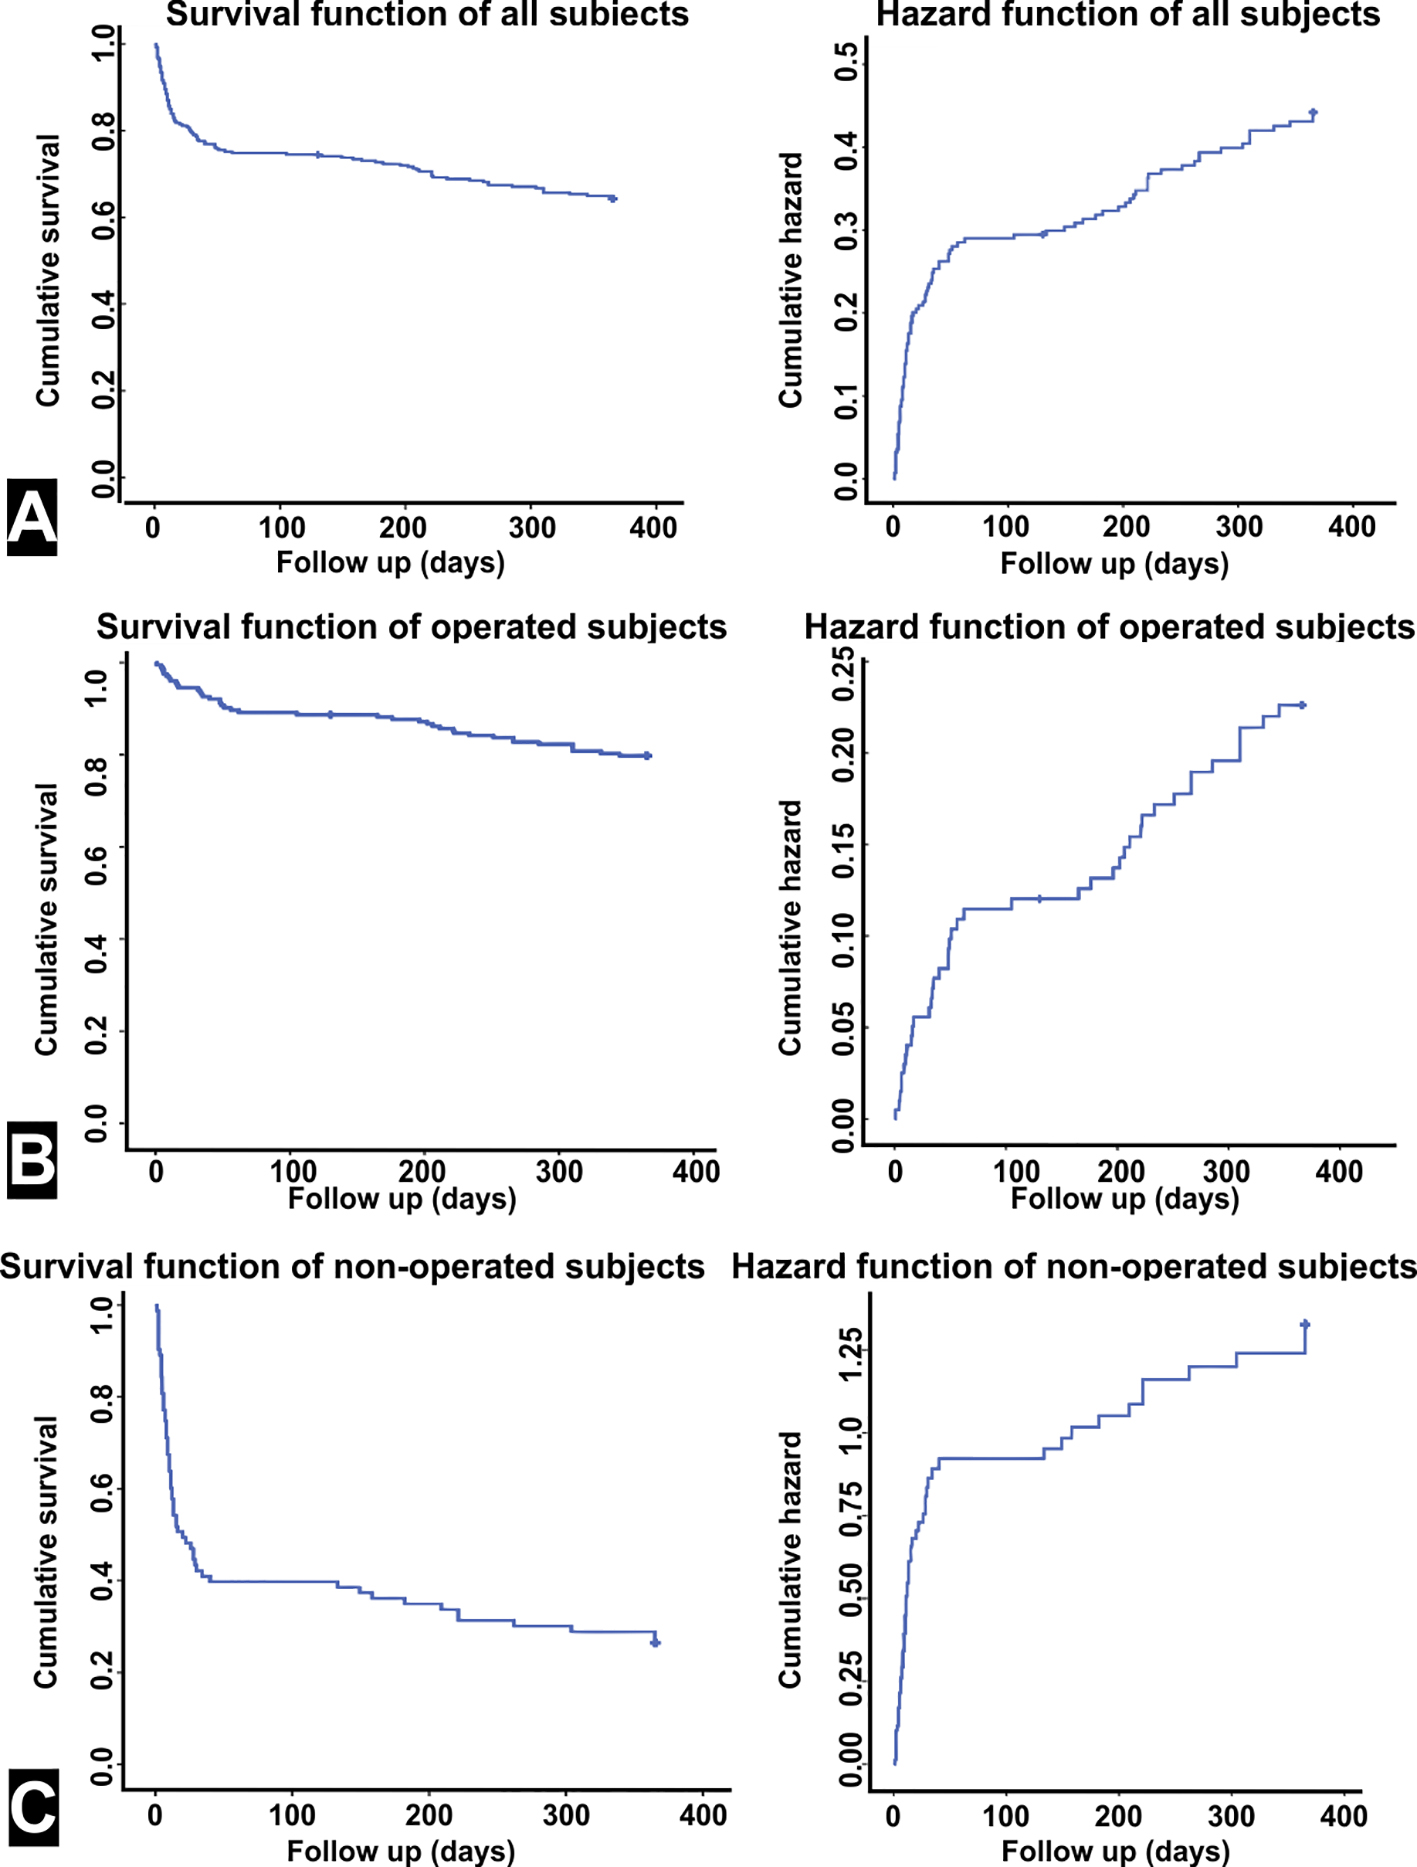
Figure 1. Survival time analyzed by Kaplan-Meier curves. (A) Analysis to all subjects. The survival time was 263.88 ± 8.94 days (64.28%) (left graph). The hazard cumulative risk to all subjects was 44.17% (right graph). (B) Analysis only for operated subjects. The survival time was 316.82 ± 7.66 days (79.75%) (left graph). The hazard cumulative risk to operated subjects was 22.62% (right graph). (C) Analysis only for non-operated subjects. The survival time was 134.45 ± 17.64 days (26.50%) (left graph). The hazard cumulative risk to non-operated subjects was 132.77% (right graph).
Figure 2.
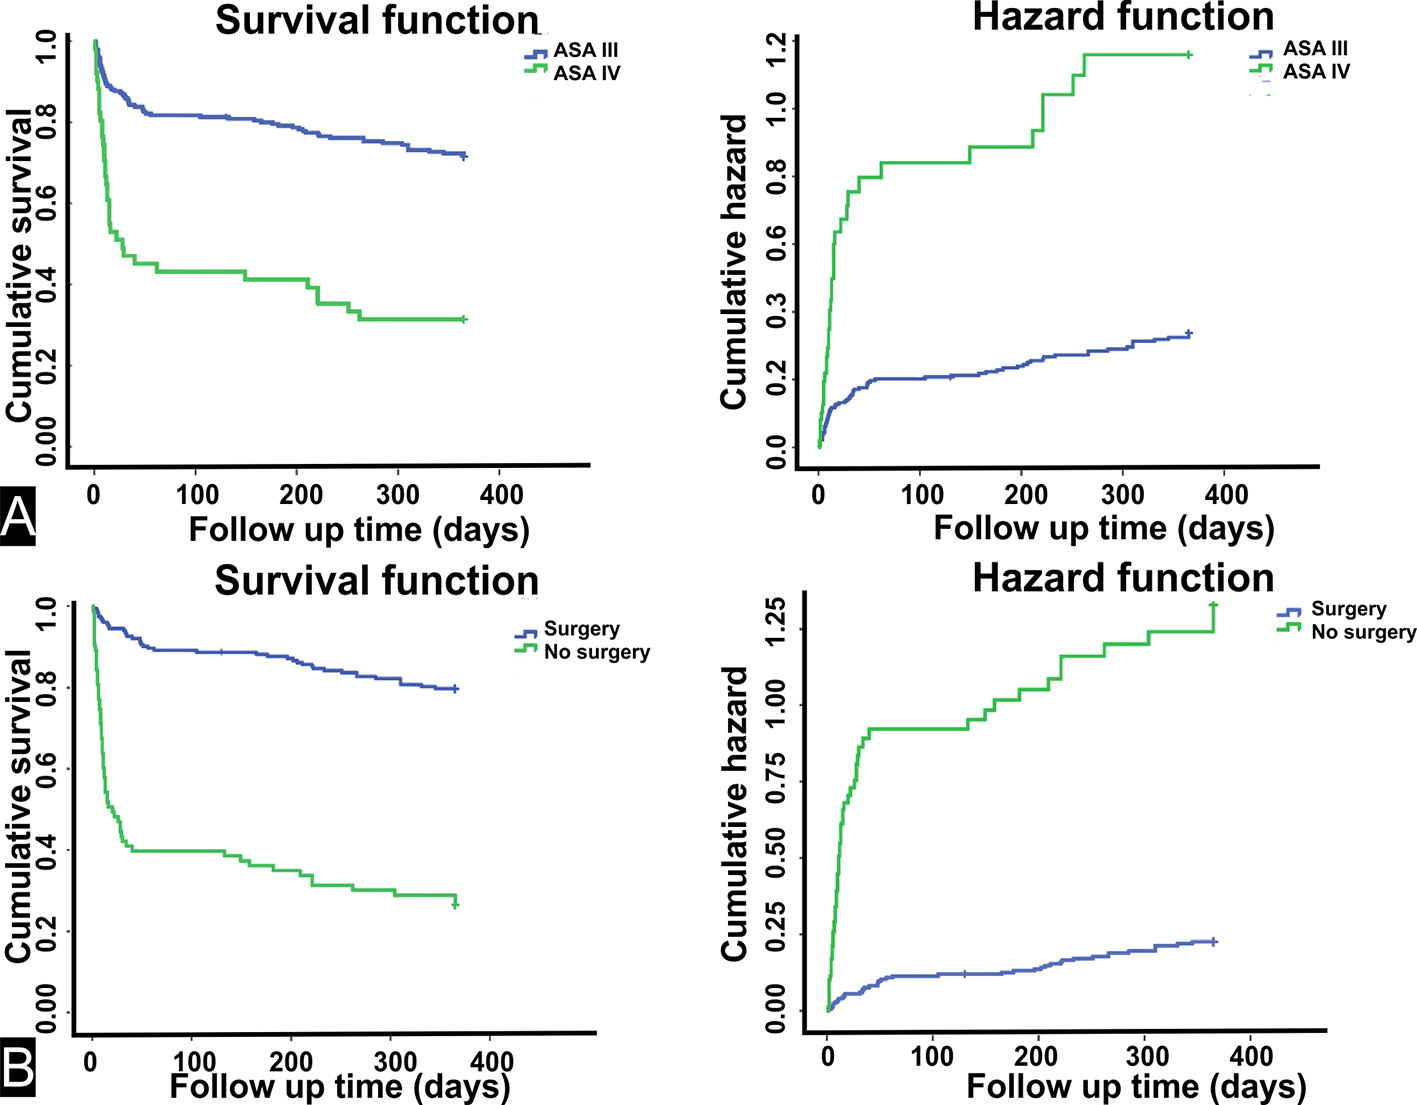
Figure 2. Comparison in the survival time for all subjects. (A) Comparing the survival time between ASA scores (ASA III and ASA IV), a difference was observed by the log rank test (Mantel-Cox) (P < 0.001). Left side: survival function graph. ASA III 289.09 ± 8.91 days (95% CI: 271.62 - 306.56) (71.44%) and ASA IV 147.78 ± 22.56 days (95% CI: 103.57 - 192) (31.37%). Right side: hazard function graph indicating the cumulative risk after 1 year (33.63% for ASA III and 115.92% for ASA IV). (B) Comparing the survival time between status surgery (surgery or no surgery), a difference was observed by the log rank test (Mantel-Cox) (P < 0.001). Left side: survival function graph. Surgery 316.83 ± 7.66 days (95% CI: 301.82 - 331.83) (79.75%) and no surgery 134.46 ± 17.64 days (95% CI: 99.89 - 169.03) (26.51%). Right side: hazard function graph indicating the cumulative risk after 1 year (22.62% for surgery and 132.78% for no surgery).

Tables

Table 1. Population Characteristics
 
CharacteristicsGeneralSurgical groupNon-surgical group
IQR: interquartile range. *Significant difference between groups (P ≤ 0.05). **Asthma, chronic obstructive pulmonary disease and chronic renal failure.
Gender age (years) (mean (SD), median (IQR))
  Female82 (7), 83 (77 - 87)82 (6.9), 82 (77 - 86)*83 (7.2), 84 (78 - 87)
  Male80 (7.9), 81 (75 - 86)79 (7.1), 78 (75 - 84)*84 (8.9), 85 (80 - 89)
Fracture age (years) (mean (SD), median (IQR))
  Transtrochanteric fracture82 (7), 83 (78 - 87)82 (6.9), 82 (78 - 87)83 (7.2), 84 (79 - 87)
  Neck fracture81 (7.4), 81 (76 - 85)80 (6.8), 80 (75 - 84)83 (8.6), 84 (77 - 87)
  Subtrochanteric fracture82 (9.5), 86 (70 - 89)81 (10), 86 (70 - 89)88 (-), 88 (-)
ASA age (years) (mean (SD), median (IQR))
  ASA III81 (7.2), 82 (77 - 86)81 (6.9), 81 (76 - 86)*84 (7.9), 84 (79 - 89)
  ASA IV83 (7.5), 85 (78 - 88)85 (7.7), 87 (80 - 92)*83 (7.4), 85 (78 - 86)
Length of hospitalization (days) (mean (SD), median (IQR))12.66 (10.63), 10 (6 - 15)12.7 (9.5), 10 (7 - 15)12.57 (13.1), 9 (4 - 15)
Comorbidity (n, %)
  Yes267 (93.4)189 (93.1)78 (94)
  No19 (6.6)14 (6.9)5 (6)
Comorbidity (n, %)
  Systemic arterial hypertension180 (62.9)132 (65)48 (57.8)
  Ischemic stroke64 (22.4)19 (9.4)45 (54.2)
  Ischemic heart disease88 (30.8)56 (27.6)32 (38.6)
  Diabetes51 (17.8)31 (15.3)20 (24.1)
  Others**55 (19.2)35 (17.2)20 (24.1)


Table 2. One-Year Mortality Predictors to All Subjects
 
CovariatesCrude HR (95% CI)Crude P valueAdjusted HR (95% CI)Adjusted P value
CI: confidence interval; HR: hazard ratio. *Asthma, chronic obstructive pulmonary disease and chronic renal failure.
Age1.053 (1.025 - 1.082)≤ 0.0011.029 (1.004 - 1.055)0.024
Gender
  FemaleReference
  Male1.222 (0.798 - 1.872)0.355RefutedRefuted
ASA score
  IIIReference
  IV3.627 (2.401 - 5.478)≤ 0.0011.425 (0.895 - 2.268)0.136
Surgery (yes/no)6.497 (4.349 - 9.704)≤ 0.0016.031 (4.008 - 9.073)≤ 0.001
Comorbidity (yes/no)1.166 (0.511 - 2.659)0.716RefutedRefuted
Comorbidity
  Systemic arterial hypertension0.694 (0.469 - 1.028)0.68RefutedRefuted
  Ischemic stroke2.414 (1.607 - 3.625)≤ 0.0011.246 (0.612 - 2.536)0.544
  Ischemic heart disease1.432 (0.958 - 2.139)0.08RefutedRefuted
  Diabetes1.363 (0.850 - 2.185)0.198RefutedRefuted
  Others*1.183 (0.732 - 1.912)0.493RefutedRefuted
Length of hospitalization0.999 (0.981 - 1.018)0.922RefutedRefuted
Fracture
  TrochantericReferenceRefutedRefuted
  Neck0.608 (0.221 - 1.674)0.608RefutedRefuted
  Subtrochanteric0.632 (0.226 - 1.769)0.632RefutedRefuted


Table 3. One-Year Mortality Predictors for Operated Subjects
 
CovariatesCrude HR (95% CI)Crude P valueAdjusted HR (95% CI)Adjusted P value
CI: confidence interval; HR: hazard ratio. *Asthma, chronic obstructive pulmonary disease and chronic renal failure.
Age1.049 (1.002 - 1.098)0.0411.054 (1.005 - 1.105)0.031
Gender
  FemaleReference
  Male1.162 (0.593 - 2.276)0.663RefutedRefuted
ASA grade
  IIIReference
  IV3.608 (1.516 - 8.587)0.043.236 (1.331 - 7.867)0.010
Comorbidity (yes/no)0.954 (0.294 - 3.089)0.937RefutedRefuted
Comorbidity
  Systemic arterial hypertension0.919 (0.487 - 1.735)0.795RefutedRefuted
  Ischemic stroke1.014 (0.362 - 2.846)0.978RefutedRefuted
  Ischemic heart disease1.612 (0.854 - 3.044)0.141RefutedRefuted
  Diabetes1.662 (0.793 - 3.482)0.178RefutedRefuted
  Others*0.651 (0.256 - 1.659)0.369RefutedRefuted
Length of hospitalization1.029 (1.009 - 1.050)0.0041.036 (1.016 - 1.057)≤ 0.001
Fracture
  TrochantericReferenceRefutedRefuted
  Neck0.326 (0.097 - 1.095)0.070RefutedRefuted
  Subtrochanteric0.420 (0.123 - 1.433)0.166RefutedRefuted


Table 4. One-Year Mortality Predictors for Non-Operated Subjects
 
CovariatesCrude HR (95% CI)Crude P valueAdjusted HR (95% CI)Adjusted P value
CI: confidence interval; HR: hazard ratio. *Asthma, chronic obstructive pulmonary disease and chronic renal failure.
Age1.020 (0.990 - 1.051)0.199RefutedRefuted
Gender
  FemaleReference
  Male1.525 (0.878 - 2.651)0.134RefutedRefuted
ASA grade
  Group oneReference
  Group two1.042 (0.630 - 1.723)0.873RefutedRefuted
Comorbidity (yes/no)1.259 (0.394 - 4.022)0.698RefutedRefuted
Comorbidity
  Systemic arterial hypertension0.554 (0.333 - 0.920)0.0230.645 (0.386 - 1.079)0.095
  Ischemic stroke0.881 (0.532 - 1.457)0.621RefutedRefuted
  Ischemic heart disease0893 (0.532 - 1.499)0.667RefutedRefuted
  Diabetes0.793 (0.429 - 1.465)0.459RefutedRefuted
  Others*1.420 (0.801 - 2.518)0.230RefutedRefuted
Length of hospitalization0.968 (0.944 - 0.992)0.0100.971 (0.496 - 0.996)0.023
Fracture
  TrochantericReferenceRefutedRefuted
  Neck0.625 (0.085 - 4.607)0.645RefutedRefuted
  Subtrochanteric0.536 (0.071 - 4.017)0.544RefutedRefuted