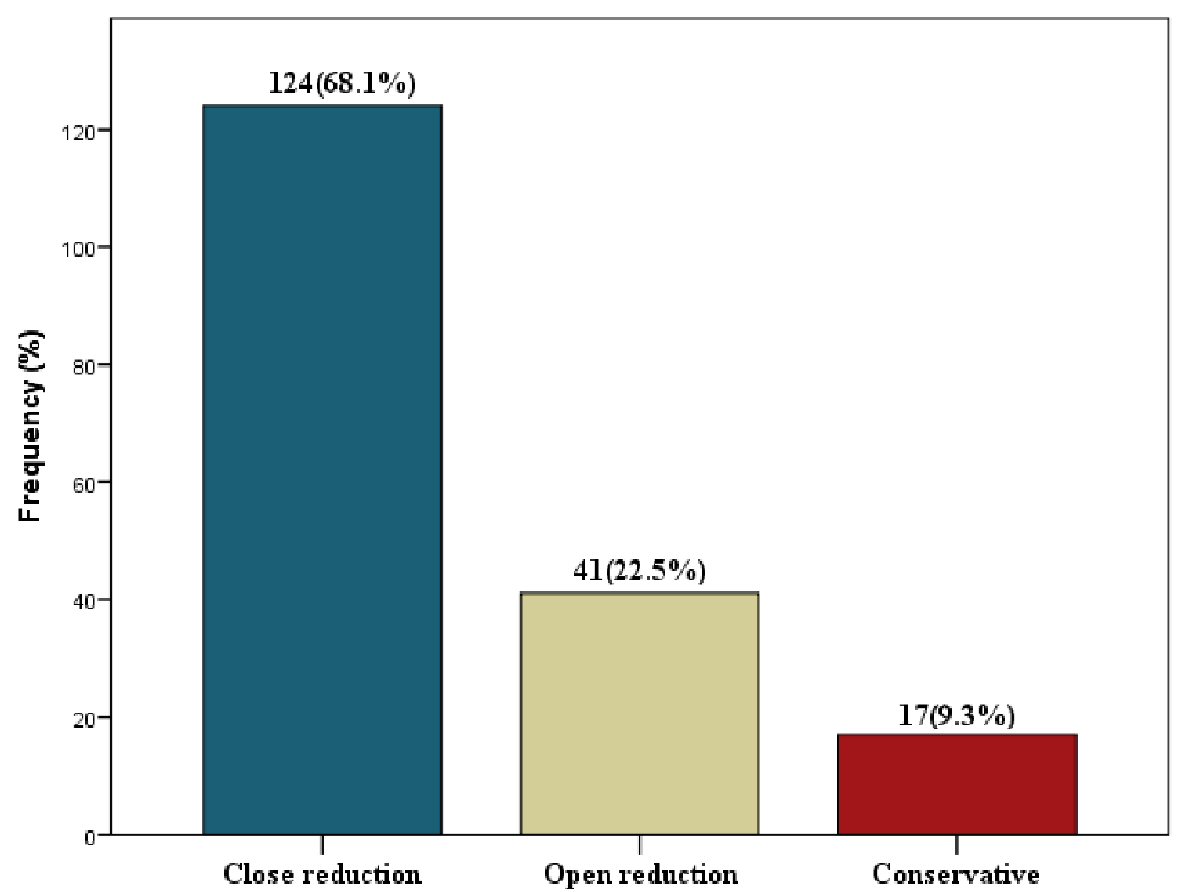
Figure 1. Treatment modalities for the maxillofacial fractures.
| Journal of Current Surgery, ISSN 1927-1298 print, 1927-1301 online, Open Access |
| Article copyright, the authors; Journal compilation copyright, J Curr Surg and Elmer Press Inc |
| Journal website http://www.currentsurgery.org |
Original Article
Volume 9, Number 4, December 2019, pages 51-56
Maxillofacial Fractures: A Three-Year Survey
Figure
Tables
| Age | Male (n = 131) | Female (n = 51) | Total | P value |
|---|---|---|---|---|
| χ2 = 8.144, P = 0.228. SD: standard deviation. | ||||
| 0 - 10 | 4 (3.1) | 2 (3.9) | 6 (3.3) | 0.894 |
| 11 - 20 | 11 (8.4) | 8 (10.4) | 19 (10.4) | 0.493 |
| 21 - 30 | 49 (37.4) | 10 (32.4) | 59 (32.4) | 0.392 |
| 31 - 40 | 41 (31.3) | 21 (41.2) | 62 (34.1) | 0.201 |
| 41 - 50 | 16 (12.2) | 6 (11.8) | 22 (12.1) | 0.588 |
| 51 - 60 | 7 (5.3) | 4 (7.8) | 11 (6.0) | 0.594 |
| > 60 | 3 (2.3) | 0 (0.0) | 3 (1.6) | 0.429 |
| Mean ± SD | 31.64 ± 11.9 | 31.47 ± 12.3 | 0.932 | |
| Male | Female | Total | P value | |
|---|---|---|---|---|
| Type of injury | ||||
| Road traffic accident | 93 (68.9) | 40 (85.1) | 133 (73.1) | 0.042 |
| Assault | 28 (20.7) | 7 (14.9) | 35 (19.2) | 0.391 |
| Fall | 9 (6.7) | 0 (0.0) | 9 (4.9) | 0.105 |
| Sport | 5 (3.7) | 0 (0.0) | 5 (2.8) | 0.557 |
| Type of road traffic accident | ||||
| Motorcycle | 33 (34.4) | 12 (31.6) | 45 (33.6) | 0.442 |
| Motor vehicle | 28 (29.2) | 14 (36.8) | 42 (31.3) | 0.104 |
| Pedestrian | 20 (20.8) | 5 (13.2) | 25 (18.7) | 0.074 |
| Tricycle | 8 (8.3) | 7 (18.4) | 15 (11.2) | 0.043 |
| Bicycle | 7 (7.3) | 0 (0.0) | 7 (5.2) | 0.089 |
| Male | Female | Total | P value | |
|---|---|---|---|---|
| NOE: naso-orbito-ethmoid. *P < 0.05. | ||||
| Site of maxillofacial fractures | ||||
| Mandible | 101 (62.0) | 41 (65.1) | 142 (62.8) | 0.003* |
| Zygomatic complex | 30 (18.4) | 5 (7.9) | 35 (15.5) | 0.043 |
| Maxilla | 26 (16.0) | 6 (9.5) | 32 (14.2) | 0.139 |
| Nasal | 1 (0.6) | 5 (7.9) | 6 (2.7) | 0.136 |
| NOE | 2 (1.2) | 2 (3.2) | 4 (1.8) | 0.943 |
| Orbit | 3 (1.8) | 4 (6.3) | 7 (3.1) | 0.432 |
| Anatomic site in maxilla | ||||
| Le Fort I | 8 (30.8) | 0 (0.0) | 8 (25.0) | 0.012* |
| Le Fort II | 10 (38.5) | 3 (50.0) | 13 (40.6) | 0.084 |
| Le Fort III | 2 (7.7) | 0 (0.0) | 2 (6.2) | 0.407 |
| Dentoalveolar | 6 (23.1) | 3 (50.0) | 9 (28.1) | 0.037* |
| Site of fracture | Male, n (%) | Female, n (%) | Total, n (%) | P value |
|---|---|---|---|---|
| *P < 0.05. | ||||
| Body | 26 (25.7) | 14 (34.1) | 40 (28.2) | 0.047* |
| Angle | 21 (20.8) | 5 (12.2) | 26 (18.3) | 0.039* |
| Parasymphysial | 19 (19.8) | 6 (14.6) | 25 (17.6) | 0.391 |
| Condylar | 10 (9.9) | 6 (14.6) | 16 (11.3) | 0.316 |
| Symphysial | 11 (10.9) | 4 (9.8) | 15 (10.6) | 0.843 |
| Dentoalveolar | 12 (11.9) | 4 (9.8) | 16 (11.3) | 0.951 |
| Coronoid | 0 (0.0) | 2 (4.9) | 2 (1.4) | 0.715 |
| Ramus | 2 (2.0) | 0 (0.0) | 2 (1.4) | 0.621 |
| Total | 101 (100.0) | 41 (100.0) | 142 (100.0) | 0.032* |
| Duration (days) | Male (n = 131) | Female (n = 51) | Total (n = 182) | P value |
|---|---|---|---|---|
| ≤ 1 | 43 (32.8) | 15 (29.4) | 58 (31.9) | 0.139 |
| 2 - 7 | 35 (26.7) | 14 (27.4) | 49 (26.9) | |
| 8 - 14 | 24 (18.3) | 8 (15.7) | 32 (17.6) | |
| 15 - 31 | 21 (16.0) | 6 (11.8) | 27 (14.8) | |
| > 31 | 8 (6.1) | 8 (15.7) | 16 (8.8) |