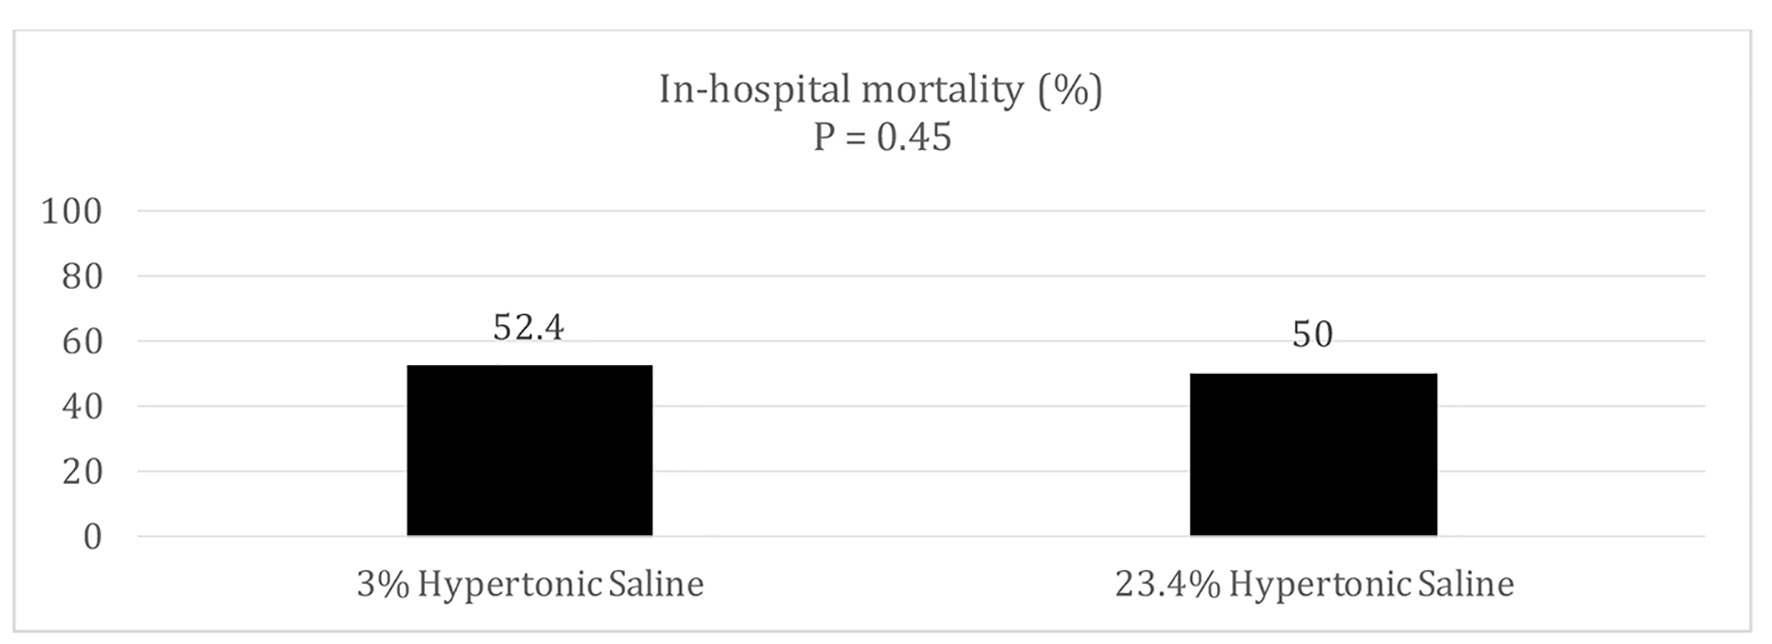
Figure 1. In-hospital mortality.
| Journal of Current Surgery, ISSN 1927-1298 print, 1927-1301 online, Open Access |
| Article copyright, the authors; Journal compilation copyright, J Curr Surg and Elmer Press Inc |
| Journal website http://www.currentsurgery.org |
Original Article
Volume 9, Number 4, December 2019, pages 39-44
Comparison of 3% vs. 23.4% Hypertonic Saline in Traumatic Brain Injury
Figures
Tables
| Characteristics | 3% HST (n = 21) | 23.4% HST (n = 10) |
|---|---|---|
| IQR: interquartile range; GCS: Glasgow coma scale; ISS: injury severity score; ICH: intracerebral hemorrhage; CT: computed tomography; HTS: hypertonic saline; ED: emergency department. | ||
| Age, median (IQR) | 61.0 (49.0 - 72.0) | 45.5 (34.3 - 68.0) |
| Sex | ||
| Male, No. (%) | 17 (81.0%) | 9 (90.0%) |
| Female, No. (%) | 4 (19.0%) | 1 (10.0%) |
| Ethnicity | ||
| Caucasian, No. (%) | 11 (52.4%) | 3 (30.0%) |
| African American, No. (%) | 3 (14.3%) | 0 (0.0%) |
| Hispanic, No. (%) | 7 (33.3%) | 4 (40.0%) |
| Asian, No. (%) | 0 (0.0%) | 3 (30.0%) |
| Admission GCS, median (IQR) | 11.0 (6.0 - 14.0) | 4.0 (3.0 - 8.8) |
| Admission ISS, median (IQR) | 22.0 (10.0 - 26.0) | 25.0 (18.3 - 25.0) |
| Admission ICH score, median (IQR) | 1.0 (0.0 - 3.0) | 1.5 (1.0 - 3.0) |
| ICH type | ||
| Subdural hematoma, No. (%) | 17 (81.0%) | 9 (90.0%) |
| Subarachnoid hemorrhage, No. (%) | 14 (66.7%) | 3 (30.0%) |
| Epidural hematoma, No. (%) | 2 (9.5%) | 0 (0.0%) |
| Intraparenchymal hemorrhage, No. (%) | 5 (23.8%) | 5 (50.0%) |
| Intraventricular hemorrhage, No. (%) | 2 (9.5%) | 1 (10.0%) |
| Infratentorial hemorrhage, No. (%) | 0 (0.0%) | 1 (10.0%) |
| Midline shift, No. (%) | 8 (38.1%) | 4 (40.0%) |
| Evidence of herniation on CT scan, No. (%) | 2 (9.5%) | 0 (0.0%) |
| Underwent neurosurgical intervention (after HTS bolus and infusion started) | 6 (28.6%) | 4 (40%) |
| Initial sodium value in ED (mEq/L), median (IQR) | 135.0 (132.0 - 138.0) | 134.5 (133.0 - 138.3) |
| Outcome | 3% HST | 23.4% HST | P value |
|---|---|---|---|
| HTS: hypertonic saline; IQR: interquartile range; GCS: Glasgow coma scale. | |||
| ICU length of stay, median (IQR) | 7.0 (5.3 - 11.3) | 10.0 (5.0 - 15.0) | 0.23 |
| Hospital length of stay, median (IQR) | 12.5 (10.3 - 15.0) | 17.0 (11.0 - 18.0) | 0.087 |
| GCS at discharge date | 14.5 (14.0 - 15.0) | 15.0 (14.0 - 15.0) | 0.34 |
| Sodium values (mEq/L) | |||
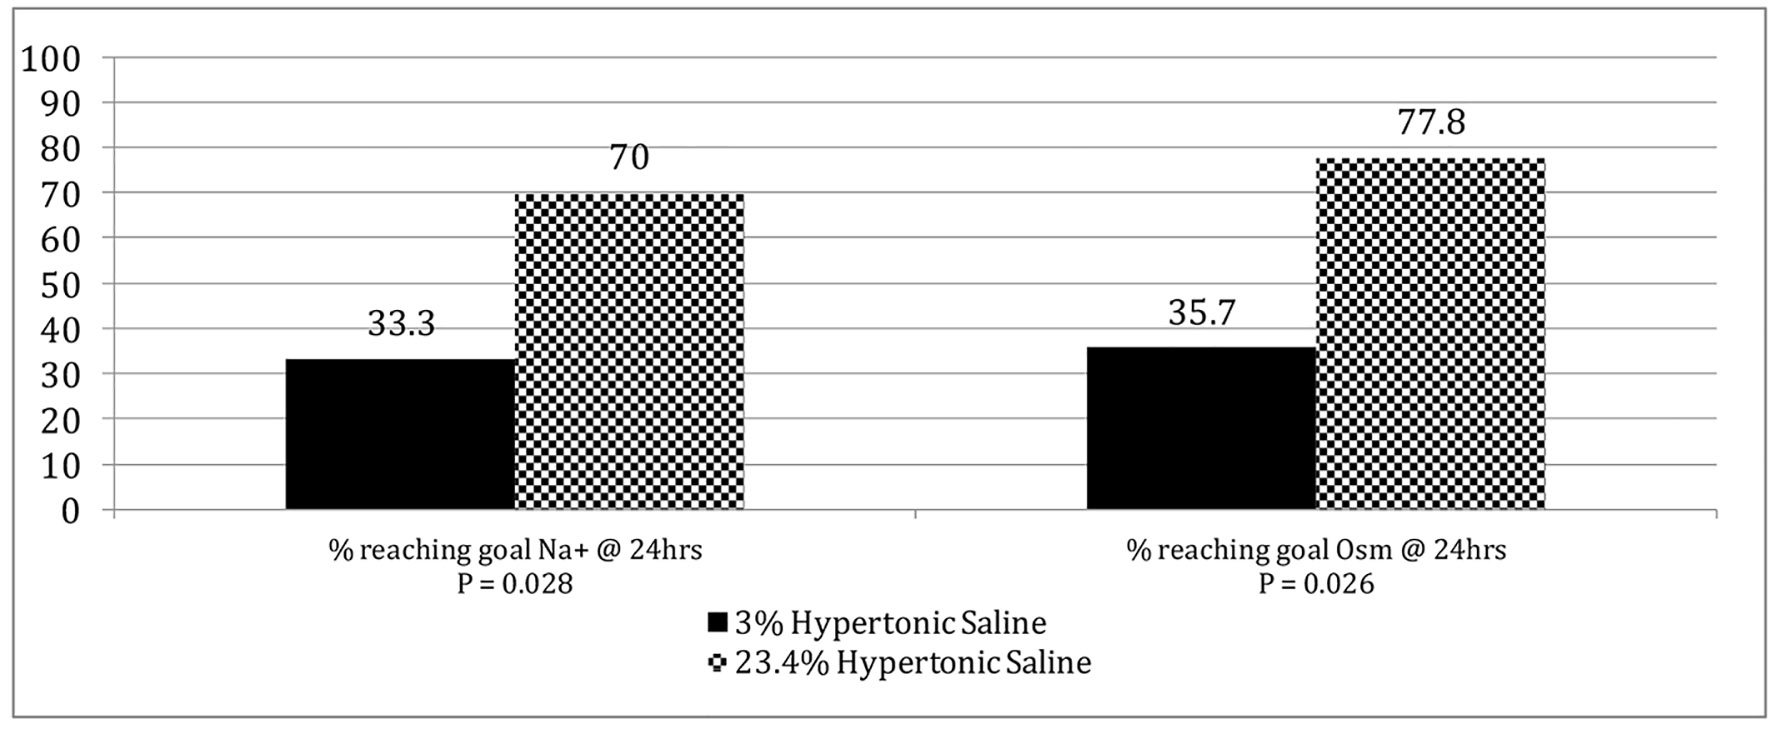
| At 24 h, median (IQR) | 144.0 (140.0 - 146.0) | 150.0 (147.5 - 153.3) | 0.015 |
| At 48 h, median (IQR) | 149.0 (141.3 - 154.8) | 155.0 (145.0 - 159.0) | 0.09 |
| At 72 h, median (IQR) | 150.0 (142.0 - 152.0) | 155.0 (145.5 - 157.0) | 0.068 |
| Serum Osm value (mOsm/kg) | |||
| At 24 h, median (IQR) | 301.5 (292.0 - 316.8) | 313.0 (310.0 - 330.0) | 0.022 |
| At 48 h, median (IQR) | 313.0 (307.0 - 326.0) | 319.0 (308.5 - 337.3) | 0.140 |
| At 72 h, median (IQR) | 313.0 (306.0 - 316.5) | 324.0 (323.0 - 341.0) | 0.030 |
| Acute kidney injury (≥ 1.5 times increase in baseline Cr) | 2 (9.5%) | 2 (20.0%) | 0.21 |
| Hypernatremia (≥ 160 mEq/L) | 0 (0.0%) | 4 (40.0%) | 0.009 |