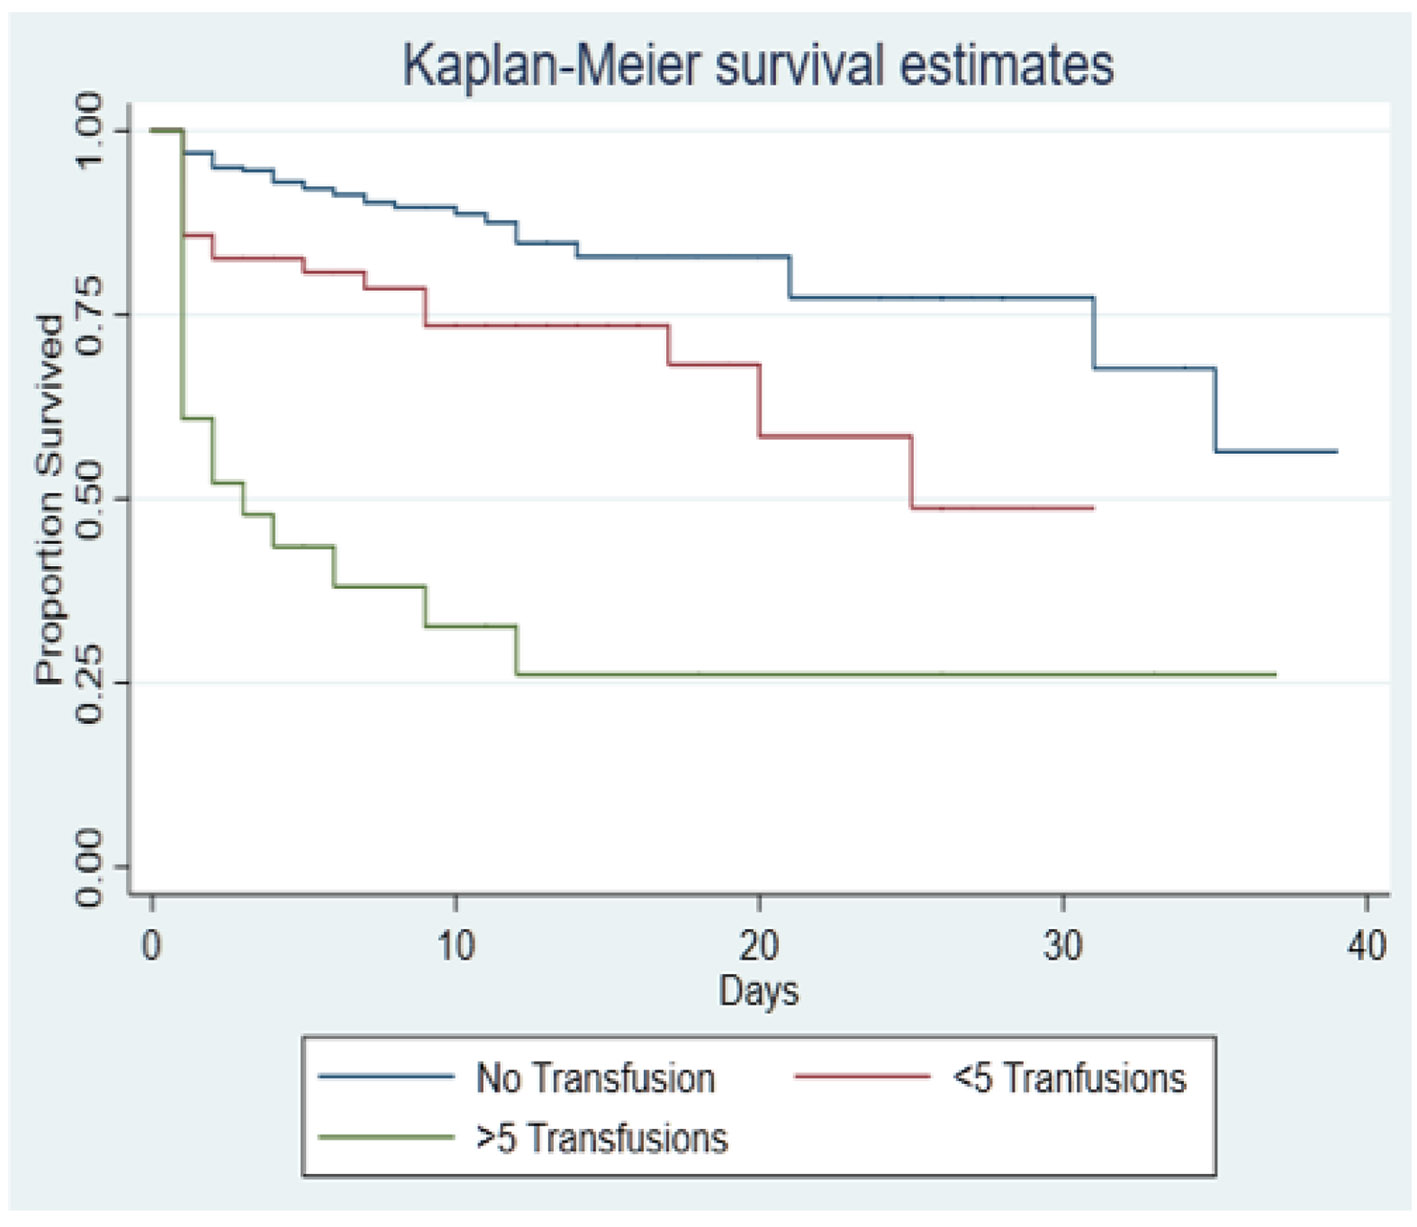
Figure 1. Kaplan-Meier 40-day survival curves according to transfusion volume.
| Journal of Current Surgery, ISSN 1927-1298 print, 1927-1301 online, Open Access |
| Article copyright, the authors; Journal compilation copyright, J Curr Surg and Elmer Press Inc |
| Journal website http://www.currentsurgery.org |
Original Article
Volume 9, Number 4, December 2019, pages 45-50
Analysis of Transfusion Volumes in the Elderly Trauma Population
Figures
Tables
| Transfused study population (N = 94) | Survivor (N = 59) | Non-survivor (N = 35) | P value | |
|---|---|---|---|---|
| LOS: length of hospital stay; SD: standard deviation; PRBC: packed red blood cell; FFP: fresh frozen plasma; ISS: injury severity score. | ||||
| LOS (days) | < 0.001 | |||
| Mean | 8.80 | 11.46 | 4.37 | |
| Median | 6.0 | 9 | 1 | |
| Range | 1 - 37 | 1 - 37 | 1 - 25 | |
| SD | 8.60 | 8.99 | 5.87 | |
| Age (years) | 0.2262 | |||
| Mean | 77.73 | 78.22 | 76.80 | |
| Median | 78.0 | 79.0 | 77.0 | |
| Range | 65 - 101 | 65 - 97 | 65 - 101 | |
| SD | 8.32 | 8.15 | 8.66 | |
| Female (%) | 60.22 | 58.62 | 62.86 | 0.6551 |
| Male (%) | 39.78 | 41.38 | 37.14 | 0.6551 |
| PRBC (% received) | 66.67 | 67.2 | 65.71 | 0.8813 |
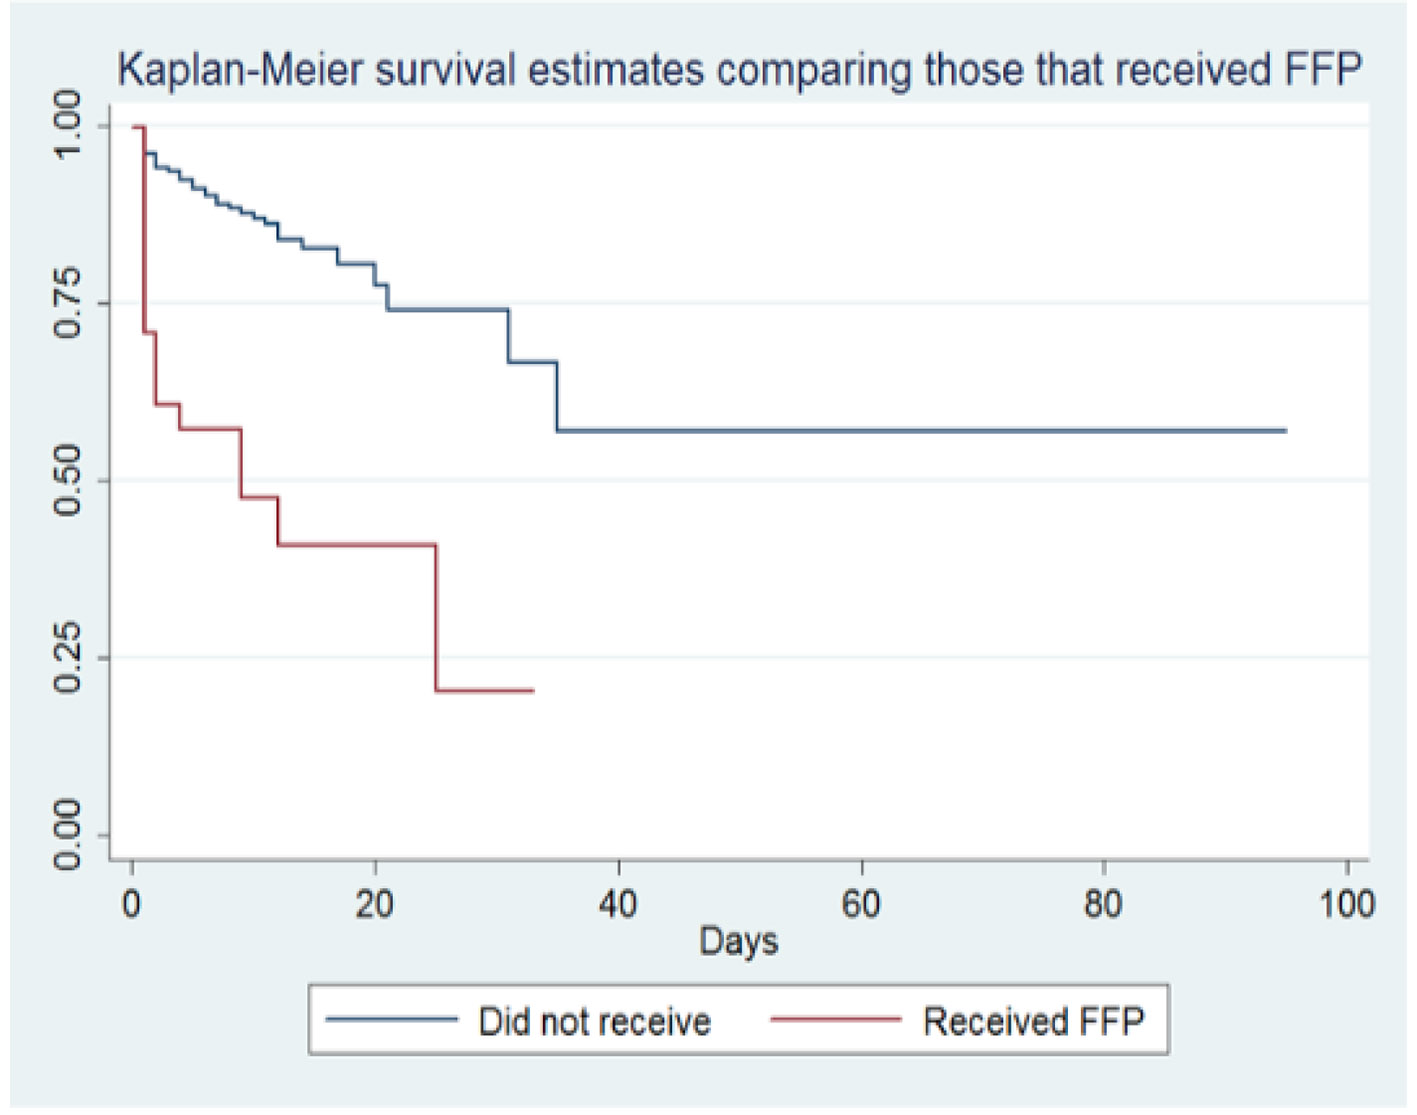
| FFP (% received) | 33.33 | 24.13 | 48.57 | 0.0152 |
| Platelets (% received) | 3.73 | 29.31 | 28.57 | 0.9402 |
| Total no. of products | 0.0044 | |||
| Mean | 3.73 | 2.87 | 5.14 | |
| Median | 2.5 | 2 | 5.5 | |
| Range | 1 - 20 | 1 - 12 | 1 - 20 | |
| SD | 4.05 | 2.41 | 8.20 | |
| Blunt injury (%) | 92.47 | 93.11 | 97.14 | < 0.0001 |
| Penetrating injury (%) | 7.53 | 6.89 | 2.86 | < 0.0001 |
| Received ≥ 5 units (%) | 19.52% | 12.06% | 45.71% | 0.0002 |
| ISS | < 0.001 | |||
| Mean | 19.13 | 16.13 | 25.11 | |
| Median | 17 | 14 | 25 | |
| Range | 1 - 75 | 1 - 43 | 9 - 75 | |
| SD | 10.47 | 8.19 | 11.52 | |
| ISS ≥ 16 (%) | 37.63 | 43.10 | 85.71 | < 0.001 |
| Variable | Hazard ratio | P value |
|---|---|---|
| FFP: fresh frozen plasma; ISS: injury severity score. | ||
| Age (per year) | 1.0232 | 0.05 |
| Gender | 1.5 | 0.048 |
| Number of units received | 1.52 | < 0.001 |
| Received FFP | 14.73 | < 0.001 |
| ISS | 1.233 | < 0.001 |
| Severe injury (ISS > 16) | 17.732 | < 0.001 |
| Transfusions | Hazard ratio | P value | 95% CI |
|---|---|---|---|
| CI: confidence interval. | |||
| < 5 Units | 2.48 | 0.01 | 1.46 - 4.20 |
| ≥ 5 Units | 6.27 | < 0.001 | 3.62 - 10.88 |
| Transfusions | < 5 Units | ≥ 5 Units | P value |
|---|---|---|---|
| ISS: injury severity score. | |||
| Mean ISS | 18.629 | 22.217 | 0.1475 |
| Transfusions | LOS | P value | 95% CI |
|---|---|---|---|
| LOS: length of hospital stay; CI: confidence interval. | |||
| < 5 Units | 5.19 | < 0.01 | 3.68 - 6.70 |
| ≥ 5 Units | 12.47 | < 0.01 | 8.37 - 16.56 |
| Hazard ratio | P value | 95% CI | |
|---|---|---|---|
| FFP: fresh frozen plasma; CI: confidence interval. | |||
| Received FFP | 3.25 | < 0.001 | 1.91 - 5.53 |