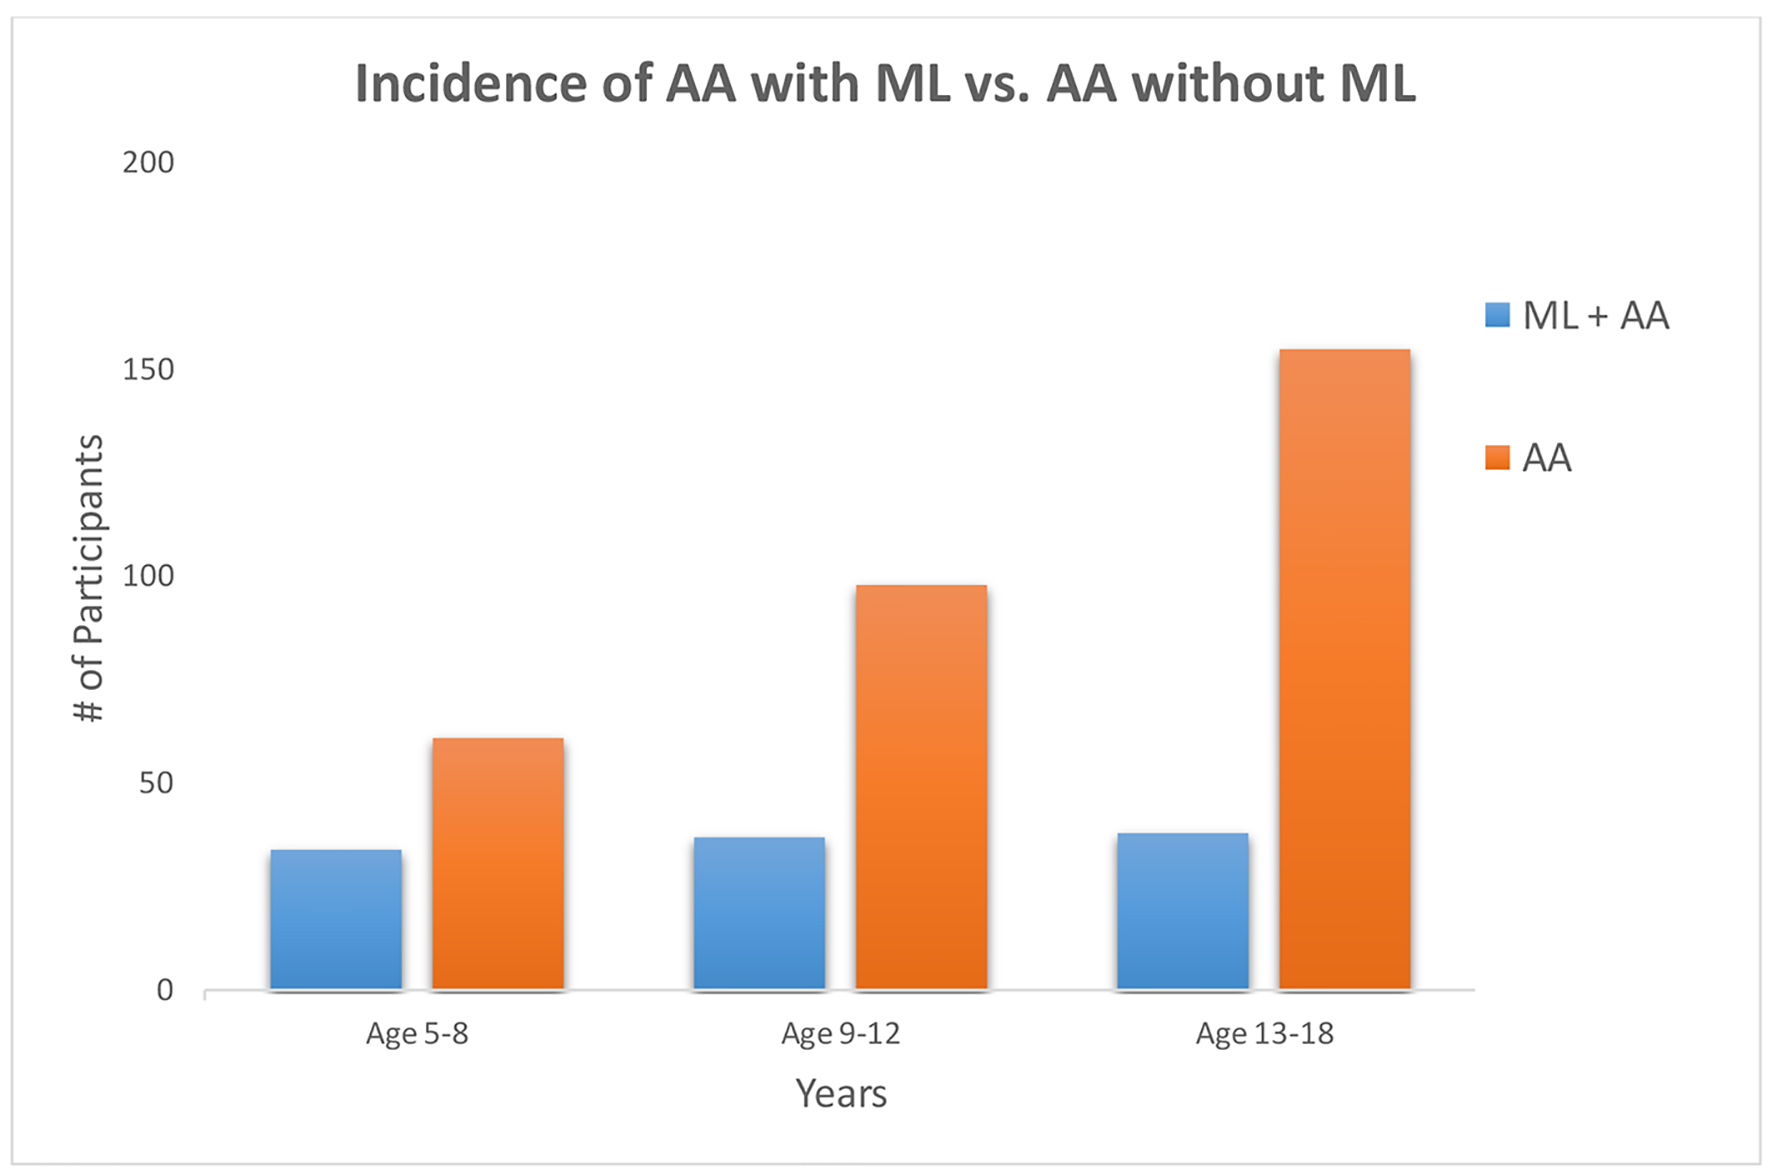
Figure 1. Incidence of ML decreases significantly after the first decade of life (P = 0.012). ML: mesenteric lymphadenitis.
| Journal of Current Surgery, ISSN 1927-1298 print, 1927-1301 online, Open Access |
| Article copyright, the authors; Journal compilation copyright, J Curr Surg and Elmer Press Inc |
| Journal website https://www.currentsurgery.org |
Original Article
Volume 10, Number 3, September 2020, pages 21-27
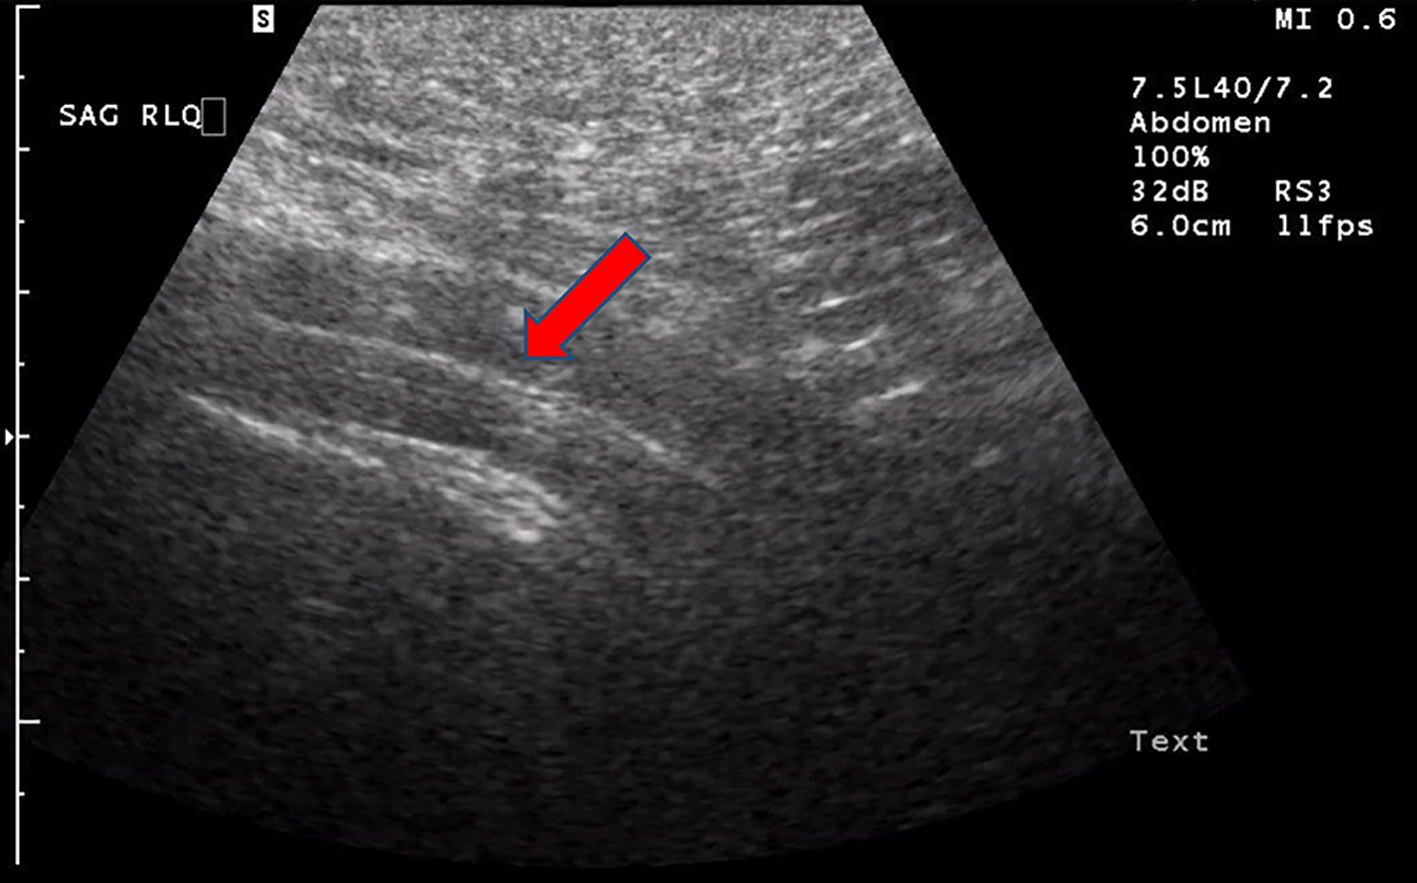
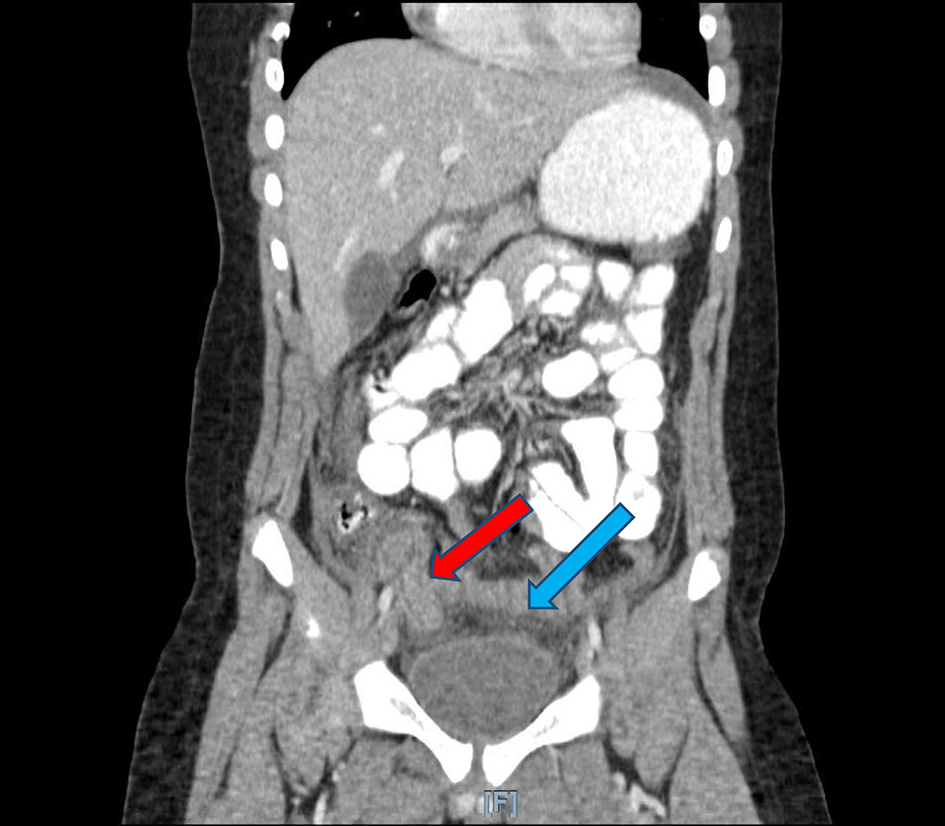
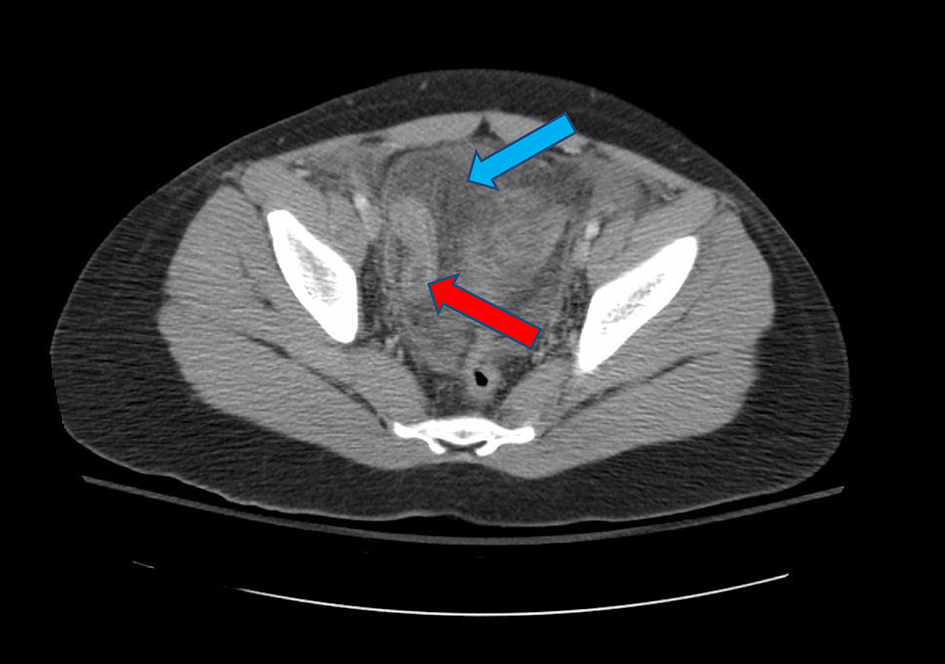
A Retrospective Comparison Study of Ultrasonography and Computed Tomography Scan in Diagnosis of Acute Appendicitis in the Pediatric Population
Figures
Tables
| CT/US (+) is indicative of positive appendicitis per radiology report. CT/US (-/equivocal) is indicative of negative appendicitis, appendix not visible, or unclear on radiology report. SD: standard deviation; CT: computed tomography; US: ultrasound. | |
| Patients (n) | 431 |
| Age at operation, years (mean ± SD) | 12.29 ± 3.87 |
| Gender (male/female) | 259/172 |
| CT/US cohorts | 192/239 |
| CT (+) | 169 |
| CT (-/equivocal) | 23 |
| US (+) | 122 |
| US (-/equivocal) | 117 |
| *Low number of subjects calculated for specificity which may not be congruent with available literature [5, 9]. PPV: positive predictive value; ML: mesenteric lymphadenitis; CT: computed tomography; US: ultrasonography. | |
| CT/US cohorts | |
| CT sensitivity/specificity (%)* | 91.16%/63.63% |
| CT PPV (%) | 97.63% |
| US sensitivity/specificity (%)* | 52.86%/83.33% |
| US PPV (%) | 98.36% |
| Positive pathology (n, %) | |
| CT | 182 (94.8%) |
| US | 227 (94.9%) |
| ML (n, %) | 109 (25.8%) |