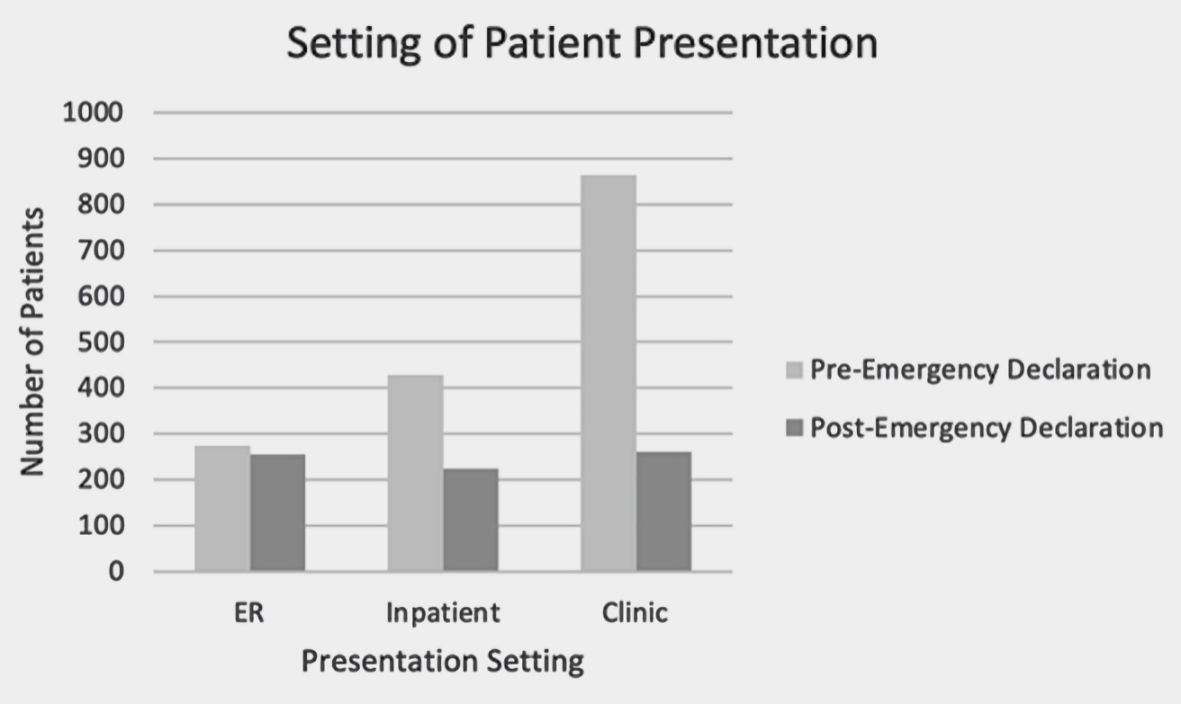
Figure 1. The setting in which patients presented for surgical care between March 14 and May 8 in 2019 and 2020. ER: emergency room.
| Journal of Current Surgery, ISSN 1927-1298 print, 1927-1301 online, Open Access |
| Article copyright, the authors; Journal compilation copyright, J Curr Surg and Elmer Press Inc |
| Journal website https://www.currentsurgery.org |
Original Article
Volume 11, Number 4, December 2021, pages 73-81
Decreases in Elective and Non-Elective Surgical Case Volumes During the COVID-19 Pandemic
Figures
Tables
| Variable name and indicators | 2019, n (%) | 2020, n (%) |
|---|---|---|
| Sex | ||
| Male | 1,277 (47) | 1,096 (47) |
| Female | 1,468 (53) | 1,215 (53) |
| Race | ||
| African American | 684 (25) | 622 (27) |
| Hispanic | 1,255 (46) | 909 (39) |
| Asian | 70 (2.6) | 46 (2) |
| Caucasian | 438 (16) | 385 (17) |
| Native American/Alaska Native | 3 (0.11) | 3 (0.13) |
| Native Hawaiian and Pacific Island | 4 (0.15) | 0 (0) |
| Other | 280 (10) | 330 (14) |
| Insurance status | ||
| Declined/unknown | 11 (0.4) | 15 (0.65) |
| Self-pay | 586 (21) | 409 (18) |
| County subsidized | 1,337 (49) | 1,255 (54) |
| Medicaid | 205 (7.5) | 179 (7.7) |
| Medicare | 228 (8.3) | 179 (7.7) |
| Private | 388 (14) | 289 (13) |
| Variable | 2019 | 2020 |
|---|---|---|
| SD: standard deviation. | ||
| Age (mean ± SD) | 48.2 ± 15.2 | 46.8 ± 15 |